Google Trends since 2006 has been open for public to search for relative popularity of certain keyword(s) that can go further back to 2004. From this Google data we can tell stories about the relative popularity over time and between different countries or regions.
In this tutorial, I will share how to track the relative popularity of multiple keywords (I’m talking tens, or even hundreds, of keywords at once).
I’m using Python to connect to Google Trends API using Pytrends, iterate the data collection over the list of keywords and integrate them using a keyword as reference. We need to do so because _Google Trends _only allow maximum of 5 keywords comparison at a time.
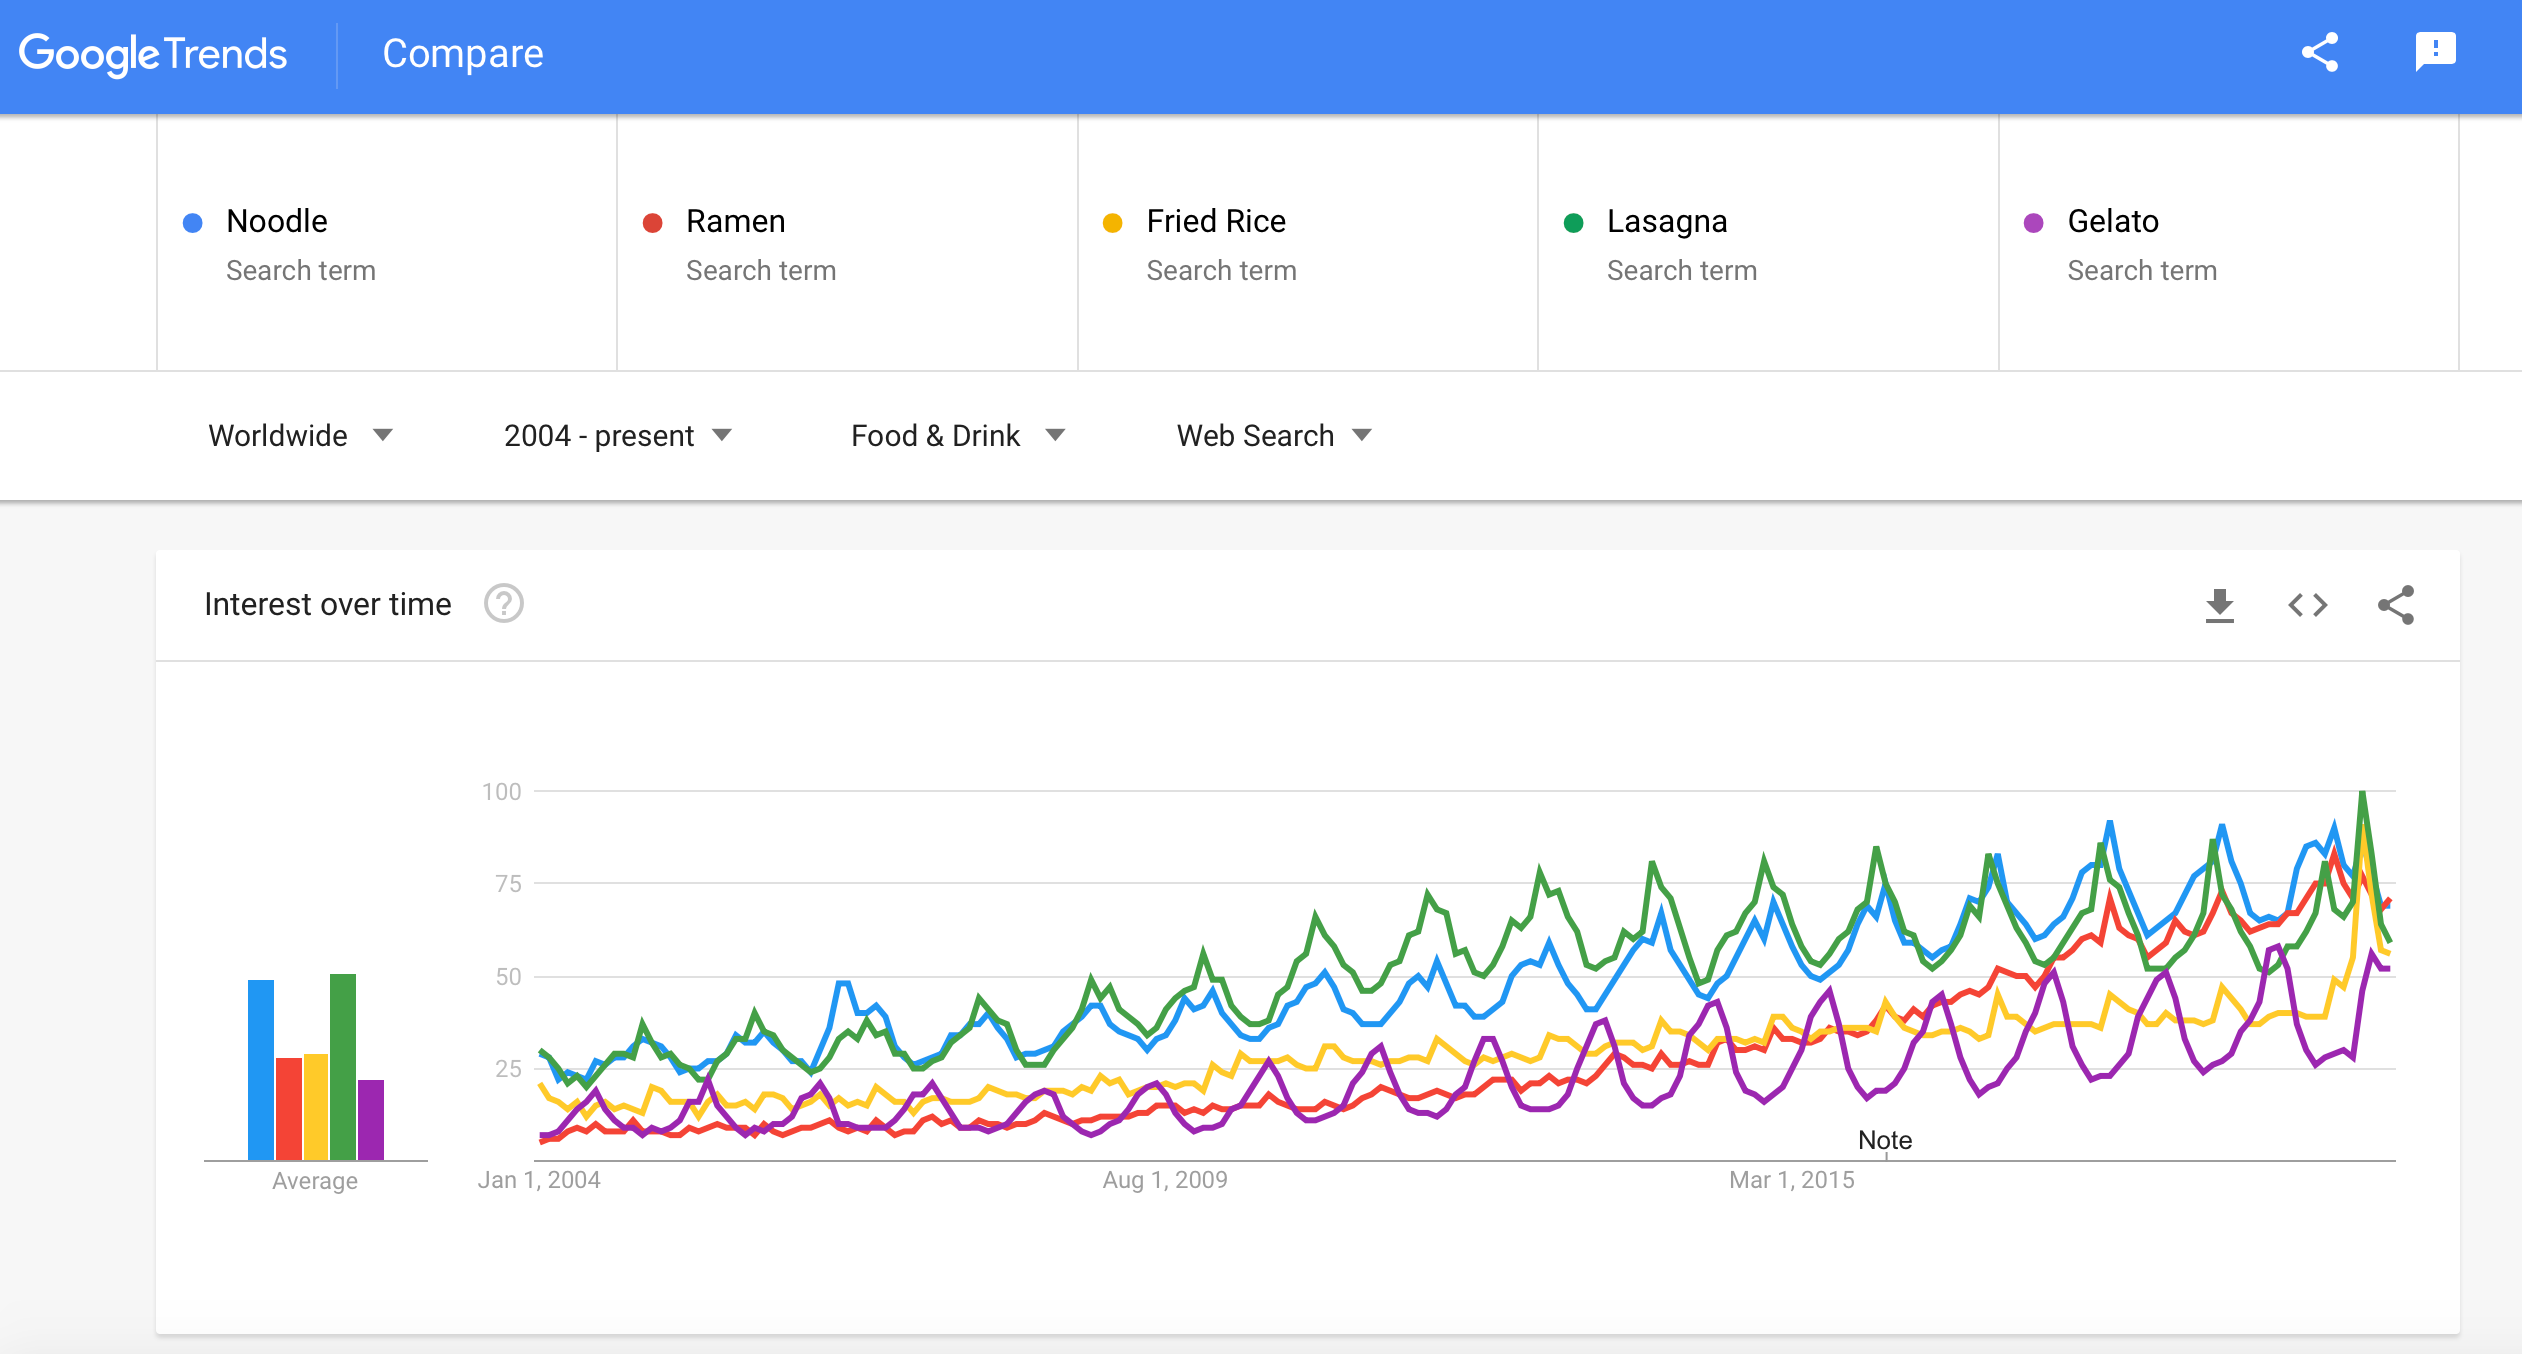
Comparing Keywords Directly on
Now let’s search for keywords about food. It will be interesting because different type of food may have different pattern of seasonality and popularity between regions, and it can be a good research for restaurant business. Also, I’m hungry. So let’s dive right in!
Preparation
First, we need to prepare the list of keywords and choose a reference keyword to enable integration of the comparisons. Note that Google Trends give the data of relative popularity and not the actual search volume. From _Google Trends _page:
“Numbers represent search interest relative to the highest point on the chart for the given region and time. A value of 100 is the peak popularity for the term. A value of 50 means that the term is half as popular. A score of 0 means there was not enough data for this term.”
Furthermore, from my experience, choosing a reference keyword that is not too popular is a good thing, because we will get more distinctive comparisons. However, the reference keyword should also be popular enough to not get 0 relative popularity.
So let’s made the list of keywords, which can be made directly in Python or in any spreadsheets. For this tutorial, I made a list of 100 food of several popular cuisines around the world.
Connecting to Google API & Collecting Data
Let’s jump into Python now. The first thing to do is importing libraries and connecting to Google API:
# pip install pytrends
import pandas as pd
from pytrends.request import TrendReq

pytrends = TrendReq(hl=’en-US’, tz=360)
Next, reading the list and creating iteration to get the _Google Trends _data of all the keywords on the list. For this, I created a function to collect _Google Trends _data over time (temporal data):
I also created a function to collect _Google Trends _data by region or country (spatial data):
Several important parameters (details here):
- kw_list is a list of keywords to search,
- geo can be set to certain country code, e.g ‘US’, or ‘’ for worldwide,
- cat can be set to certain category, e.g. All category: 0, Food & Drink: 71,
- timeframe can be set to past 5 years
'today 5-y', 2004 to present'all', etc.
Each function results in 25 files (100 keywords divided by 4) with each file containing comparison of 4 keywords + the reference keyword. Next, we will integrate these files and normalize the relative popularity accordingly.
#google #data-science #google-trends #analytics #data-visualization #data analysis