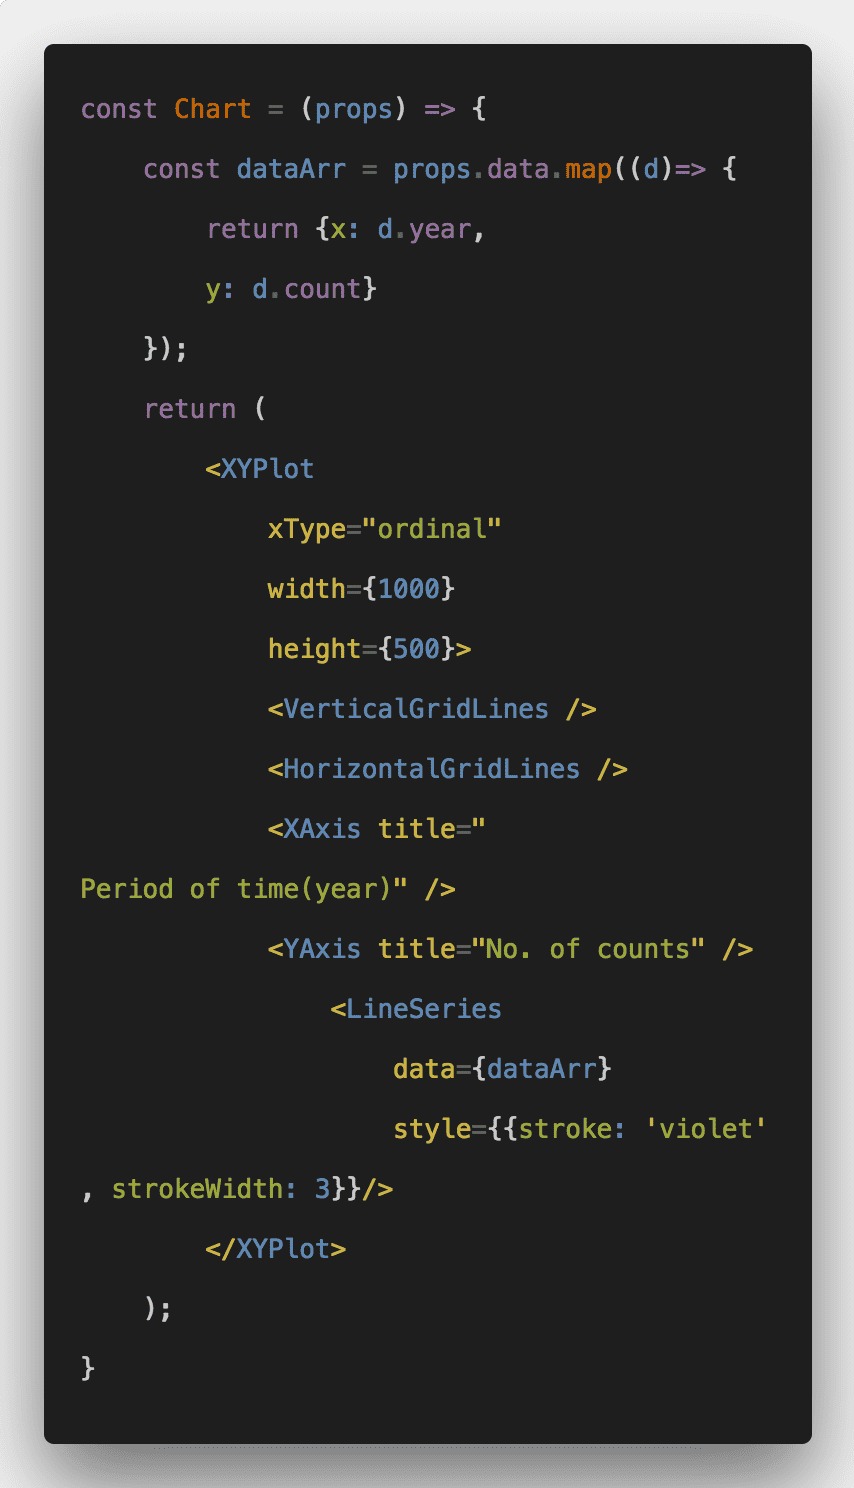
In this tutorial, we will see React Data Visualization. We will use uber chart data–visualization charting-library visualization react.React-vis is a React visualization library created by Uber. With it, you can quickly create simple charts, such as line, area, bar charts, pie and donut charts, treemaps and many more. Modern web application front ends are usually developed using one of the significant UI frameworks, such as Ember, React, Vue, or Angular. Depends on the framework you are using; you may want to ensure that the library plays well with it. Most of the charting libraries are framework agnostic. We use React-vis library for creating a React Data Visualization. So let us get started.
React Data Visualization Tutorial
First, we install the React js then we will start our example.
#react data visualization #react js #react-vis #vue #angular #node.js