Learning a valuable Embedding Representation for Time Series Sequences
In a parallel universe, our wish would be to carry out portfolio management only using patterns hidden in the past to anticipate future price changes. Nowadays, the adoption of these kinds of techniques to financial markets is quite useless. The reason is simple: the market is driven by stochastic patterns which make vanish a lot of our forecasting trials.
What we can do to achieve the best is to combine variegated data sources, comparing stock behaviors, identifying correlations, and grouping.
In this post, we try to build an architecture for stock market feature encoding. It receives temporal sequences of stock prices, plus other external data sources, and returns a learned numerical representation of them. The obtained embeddings can be used later for various tasks of our interest such as forecasting, clustering, graphical visualization, and so on. The learning process is computed using the correlation indexes as discriminator terms for our neural network architecture. For this reason, the name is Corr2Vec.
THE DATA
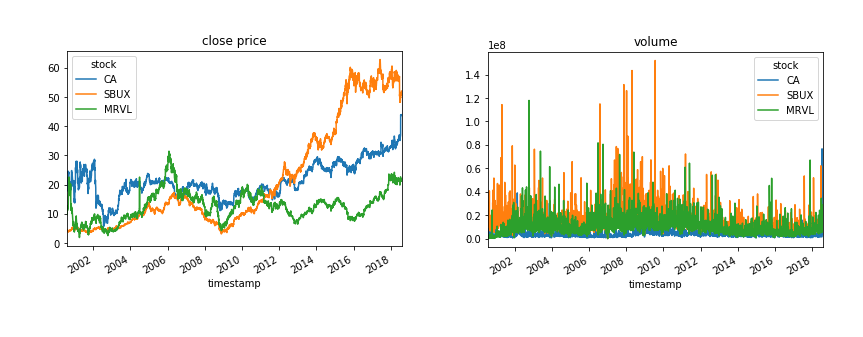
Financial data are easily accessible from various sources. For our task, a complete dataset with collected prices of various stocks is sufficient. A dataset that satisfies these needs can be found on Kaggle. The Stock data 2000–2018 is a cleaned collection of stock prices from 2000 to 2018 of around 39 different stocks. More precisely are reported volumes, open, high, low, and close prices daily.
THE MODEL
The training process of our architecture follows a supervised approach. We need labels but these labels can be retrieved easily and freely by the structure of our data. This is because we set as labels the correlation coefficients between series. The Pearson correlation coefficient is a well-known index in statistics and machine learning. In the context of time series analysis, it says to us how two series tend to move together but it doesn’t say anything about causal implications. In philosophical terms, it can be interpreted as a measure of similarity for time series considering only trend behaviors.
#towards-data-science #machine-learning #correlation #wavenet #data-science #data analysis