Many a time, I have seen beginners in data science skip exploratory data analysis (EDA) and jump straight into building a hypothesis function or model. In my opinion, this should not be the case. We should first perform an EDA as it will connect us with the dataset at an emotional level and yes, of course, will help in building good hypothesis function.
EDA is a very crucial step. It gives us a glimpse of what our data set is all about, its uniqueness, its anomalies and finally it summarizes the main characteristics of the dataset for us. In this post, I will share a very basic guide for performing EDA.
**Step 1: Import your data set **and have a good look at the data.
In order to perform EDA, we will require the following python packages.
Packages to import:
import numpy as np
	import pandas as pd
	import matplotlib.pyplot as plt
	import seaborn as sns
	from collections import defaultdict
	%matplotlib inline
view raw
exploratory_analysis1.py hosted with ❤ by GitHub
Once we have imported the packages successfully, we will move on to importing our dataset. You must be aware of read_csv() tool from pandas for reading csv files.
Import the dataset:
For the purpose of this tutorial, I have used Loan Prediction dataset from Analytics Vidhya. If you wish to code along, here is the link.
The dataset has been successfully imported. Let’s have a look at the Train dataset.
Train.head()
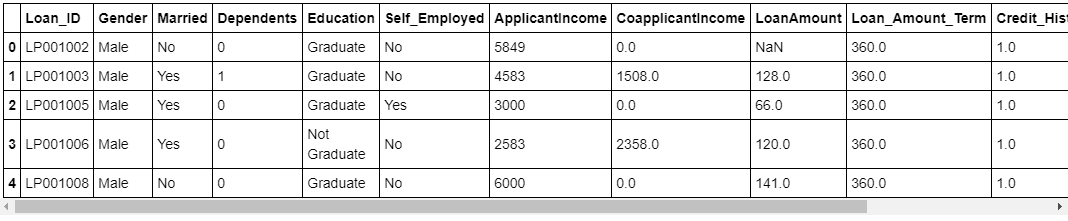
Fig 1 : Overview of Train dataset
#data-science #python #pandas #data-analysis #data-visualization #data analysis