Web development tools allow you to test and debug the JavaScript code. Web development tools are often called devtools.
Modern web browsers such as Google Chrome, Firefox, Edge, Safari, and Opera provide the devtools as built-in features.
Generally, devtools allow you to work with a variety of web technologies such as HTML, CSS, DOM, and JavaScript.
In this tutorial, you will learn how to open the Console tab of the devtools to view messages output by JavaScript.
Google Chrome
First, open the devtools.html file.
The devtools.html file has the following JavaScript cod
<script>
    console.log('Hello, devtools!');

    // the following code causes an error
    let greeting = msg;
</script>
Second, press F12 on Windows or Cmd+Opt+J if you are on Mac.
The devtools will open the Console tab by default. It will look like this:
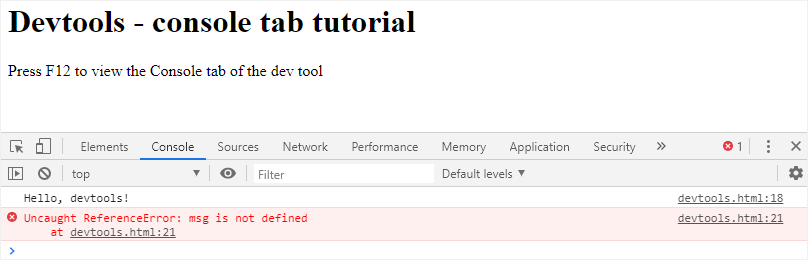
The first message is 'Hello, DevTools!' which is the output of the following command:
console.log('Hello, DevTools!');
To output the value of the variable, you use the following console.log() method. For example:
let message = 'Good Morning!';
console.log(message);
The second message that appeared on the Console tab is an error.
Uncaught ReferenceError: msg is not defined
This is because the variable msg has not been defined in the code but was referenced in the assignment.
#javascript #programming #developer #web-development