The creation of a precompiled header (PCH) is a proven strategy for improving build times. A PCH eliminates the need to repeatedly parse a frequently included header by processing it only once at the beginning of a build. The selection of headers to precompile has traditionally been viewed as a guessing game, but not anymore! In this article, we will show you how to use the vcperf analysis tool and the C++ Build Insights SDK to pinpoint the headers you should precompile for your project. We’ll walk you through building a PCH for the open source Irrlicht project, yielding a 40% build time improvement.
How to obtain and use vcperf
The examples in this article make use of vcperf, a tool that allows you to capture a trace of your build and to view it in the Windows Performance Analyzer (WPA). The latest version is available in Visual Studio 2019.
1. Follow these steps to obtain and configure _vcperf _and WPA:
- Download and install the latest Visual Studio 2019.
- Obtain WPA by downloading and installing the latest Windows ADK.
- Copy the perf_msvcbuildinsights.dll file from your Visual Studio 2019’s MSVC installation directory to your newly installed WPA directory. This file is the C++ Build Insights WPA add-in, which must be available to WPA for correctly displaying the C++ Build Insights events.
- MSVC’s installation directory is typically:
C:\Program Files (x86)\Microsoft Visual Studio\2019\{Edition}\VC\Tools\MSVC\{Version}\bin\Hostx64\x64. - WPA’s installation directory is typically:
C:\Program Files (x86)\Windows Kits\10\Windows Performance Toolkit. - Open the perfcore.ini file in your WPA installation directory and add an entry for the perf_msvcbuildinsights.dll file. This tells WPA to load the C++ Build Insights add-in on startup.
You can also obtain the latest vcperf and WPA add-in by cloning and building the vcperf GitHub repository. Feel free to use your built copy in conjunction with Visual Studio 2019!
2. Follow these steps to collect a trace of your build:
- Open an elevated x64 Native Tools Command Prompt for VS 2019.
- Obtain a trace of your build:
- Run the following command:
vcperf /start MySessionName. - Build your C++ project from anywhere, even from within Visual Studio (vcperf collects events system-wide).
- Run the following command:
vcperf /stop MySessionName outputFile.etl. This command will stop the trace, analyze all events, and save everything in the outputFile.etl trace file. - Open the trace you just collected in WPA.
Viewing header parsing information in WPA
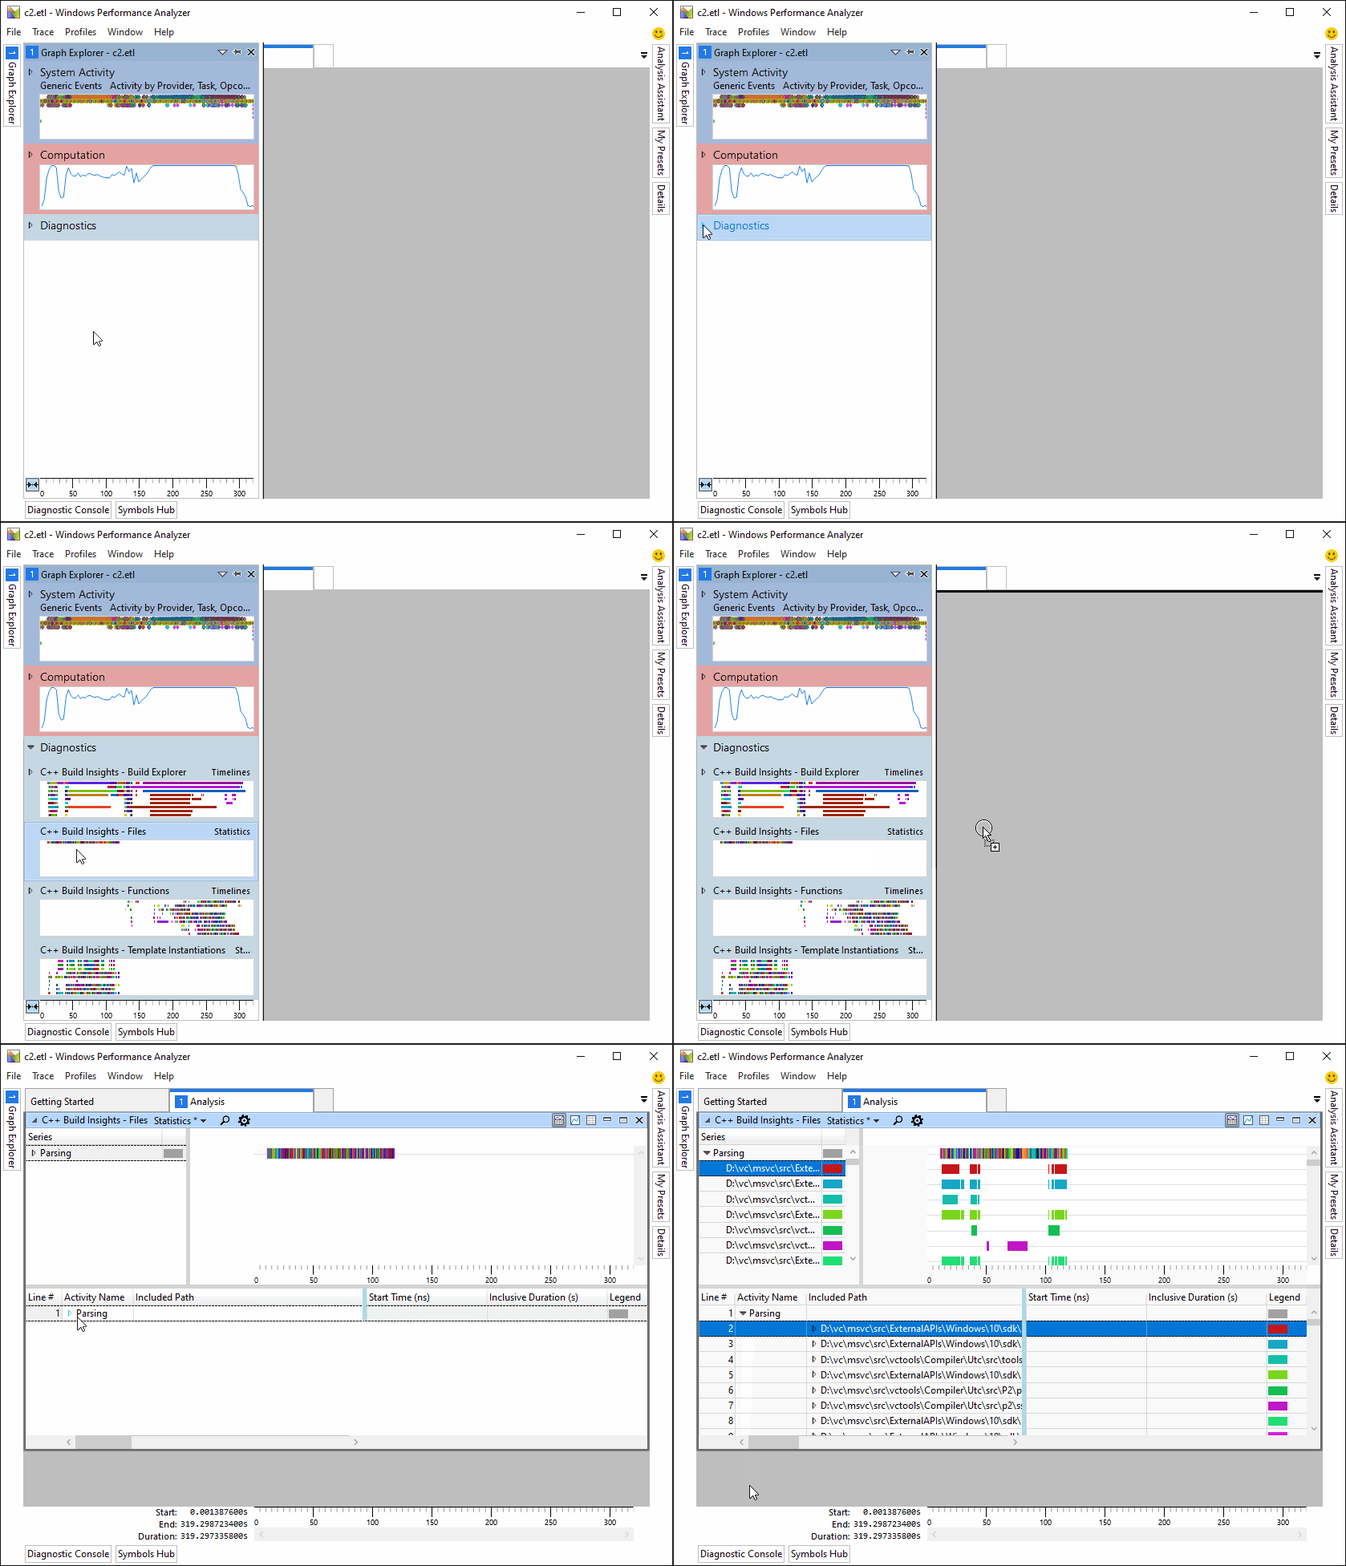
C++ Build Insights provides a WPA view called Files that allows you to see the aggregated parsing time of all headers in your program. After opening your trace in WPA, you can open this view by dragging it from the Graph Explorer pane to the Analysis window, as shown below.
The most important columns in this view are the ones named Inclusive Duration and Count, which show the total aggregated parsing time of the corresponding header and the number of times it was included, respectively.
#c++ #diagnostics #cplusplus #programming-c

