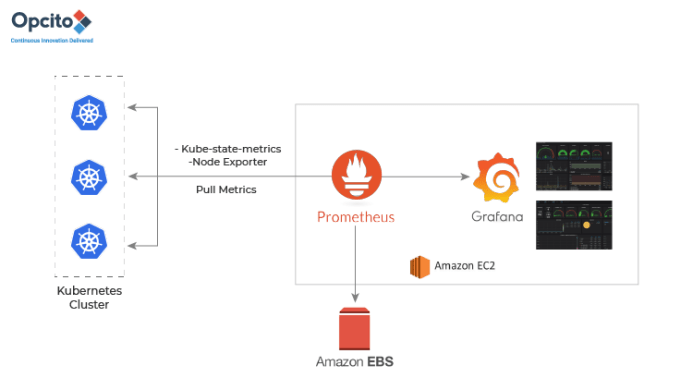
This article will guide you quickly on How to Deploy Metrics servers in Kubernetes cluster which will monitor resource utilization of the resources such as CPU, Memory, network and disk utilization of your POD and kubernetes cluster nodes.
Once you deploy your kubernetes cluster you may need to monitor the same on utilization front. Like you need to gather the current utilization of the resources of the cluster nodes and PODS. There are a number of open-source solutions available today, such as the Metrics-Server, Prometheus,Elastic Stack, and proprietary solutions like Datadog and Dynatrace.
However in this article we are going to learn How to Deploy Metrics servers in Kubernetes cluster which will monitor your resources.
Steps:
-
Clone the yaml scripts required for spinning up the Metrics server.
-
Change the directory to kubernetes-metics-server
You will notice that, “metrics-server-d58c94f4d-k2bzc” has been created.
That means we have successfully deployed metrics server.
#devops

