When it comes to regression analysis — outliers (or values that are well outside of the mean for a particular set of data) can cause issues.
Background
Let’s consider this issue further using the Pima Indians Diabetes dataset.
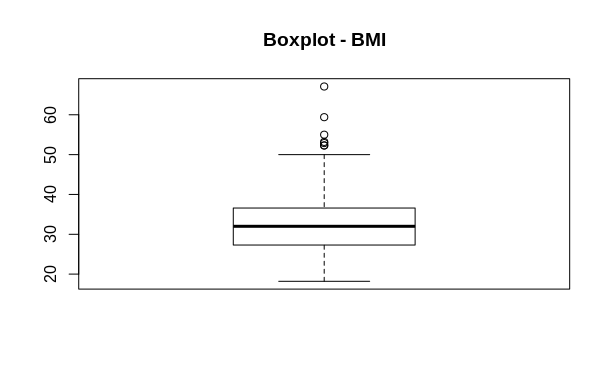
Here is a boxplot of BMI values across patients. We can see that according to the above boxplot, there are several outliers present that are much larger than that indicated by the interquartile range.
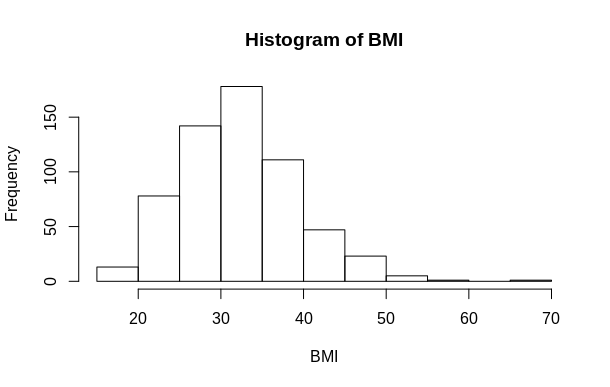
Furthermore, we also have visual indication of a positively skewed distribution — where several positive outliers “push” the distribution out to the right:
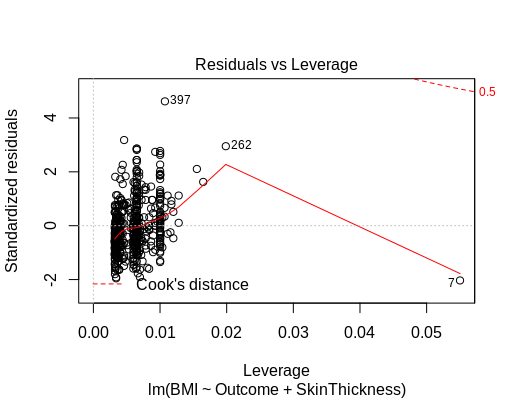
Outliers can cause issues when it comes to conducting regression analysis. A key assumption of this model is the line of best fit, or the regression line that minimises the distance between the regression line and the individual observations.
Clearly, if outliers are present, then this weakens the predictive power of the regression model as the line of best fit. It also violates the assumption that the data is normally distributed.
In this regard, both an OLS regression model and robust regression models (using Huber and Bisquare weights) are run in order to predict BMI values across the test set — with a view to measuring whether accuracy was significantly improved by using the latter model.
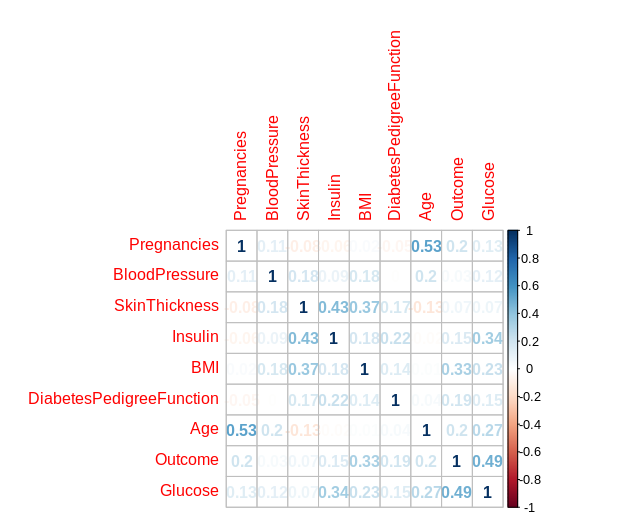
Here is a quick overview of the data and the correlations between each feature:
OLS
Using the above correlation plot in ensuring that the independent variables in the regression model are not strongly correlated with each other, the regression model is defined as follows:
reg1 <- lm(BMI ~ Outcome + Age + Insulin + SkinThickness, data=trainset)
Note that **Outcome **is a categorical variable between 0 and 1 (not diabetic vs. diabetic).
The data is split into both a training set and a test set (to serve as unseen data for the model).
For the training set — 80% of this set is used to train the regression model, while 20% is used as a validation set to assess the results.
#r-programming #regression-analysis #rstats #data-science #statistics #data analysis