Introduction
Bayesian analysis offers the possibility to get more insights from your data compared to the pure frequentist approach. In this post, I will walk you through a real life example of how a Bayesian analysis can be performed. I will demonstrate what may go wrong when choosing a wrong prior and we will see how we can summarize our results. For you to follow this post, I assume you are familiar with the foundations of Bayesian statistics and with Bayes’ theorem.
Scenario
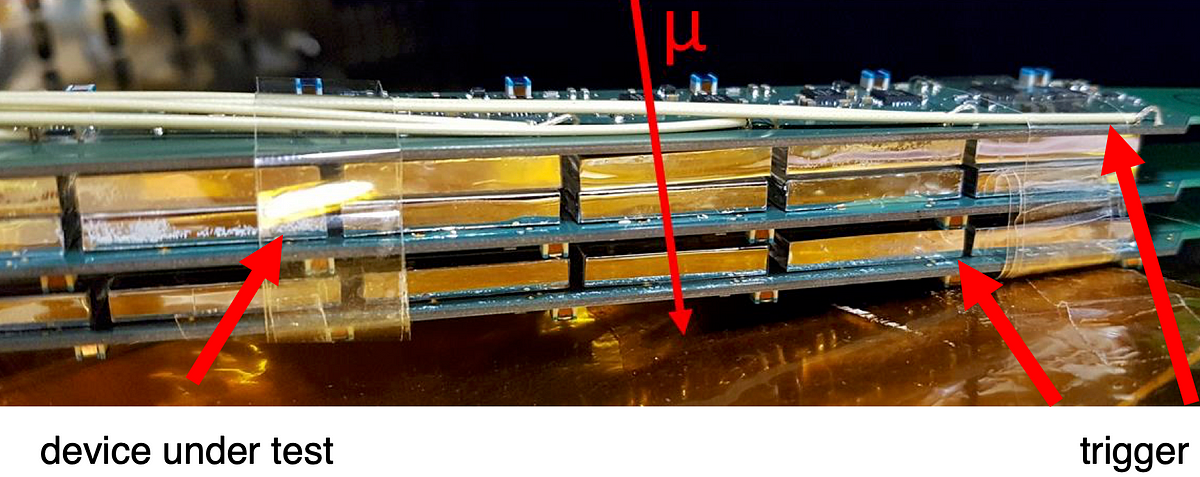
As an example analysis, we will discuss a real life problem from a physics lab. No worries, you don’t need any physics knowledge for that. We want to determine the efficiency of a particle detector. A particle detector is a sensor that may produce a measurable signal when certain particles traverse it. The efficiency of the detector we want to evaluate is the chance that the detector actually measures the traversing particle. In order to measure this, we put the detector that we want to evaluate in between two other sensors in a sandwich-like structure. If we measure a signal in the top and bottom sensors we know that a particle should have also traversed the detector in the middle. A picture of the experimental setup is shown below.

We want to measure the efficiency of a particle detector (device under test). Two different sensors (triggers) are placed on top and below the detector in order to detect particles traversing the setup (in this case muons µ).
For the measurement, we count the number of traversing particles N in a certain time (as reported by the top and bottom sensors) as well as the number of signals measured in our detector r. For this example, we assume N=100 and r=98.
#confidence-interval #data-analysis #physics #bayesian-analysis #prior #data analysis