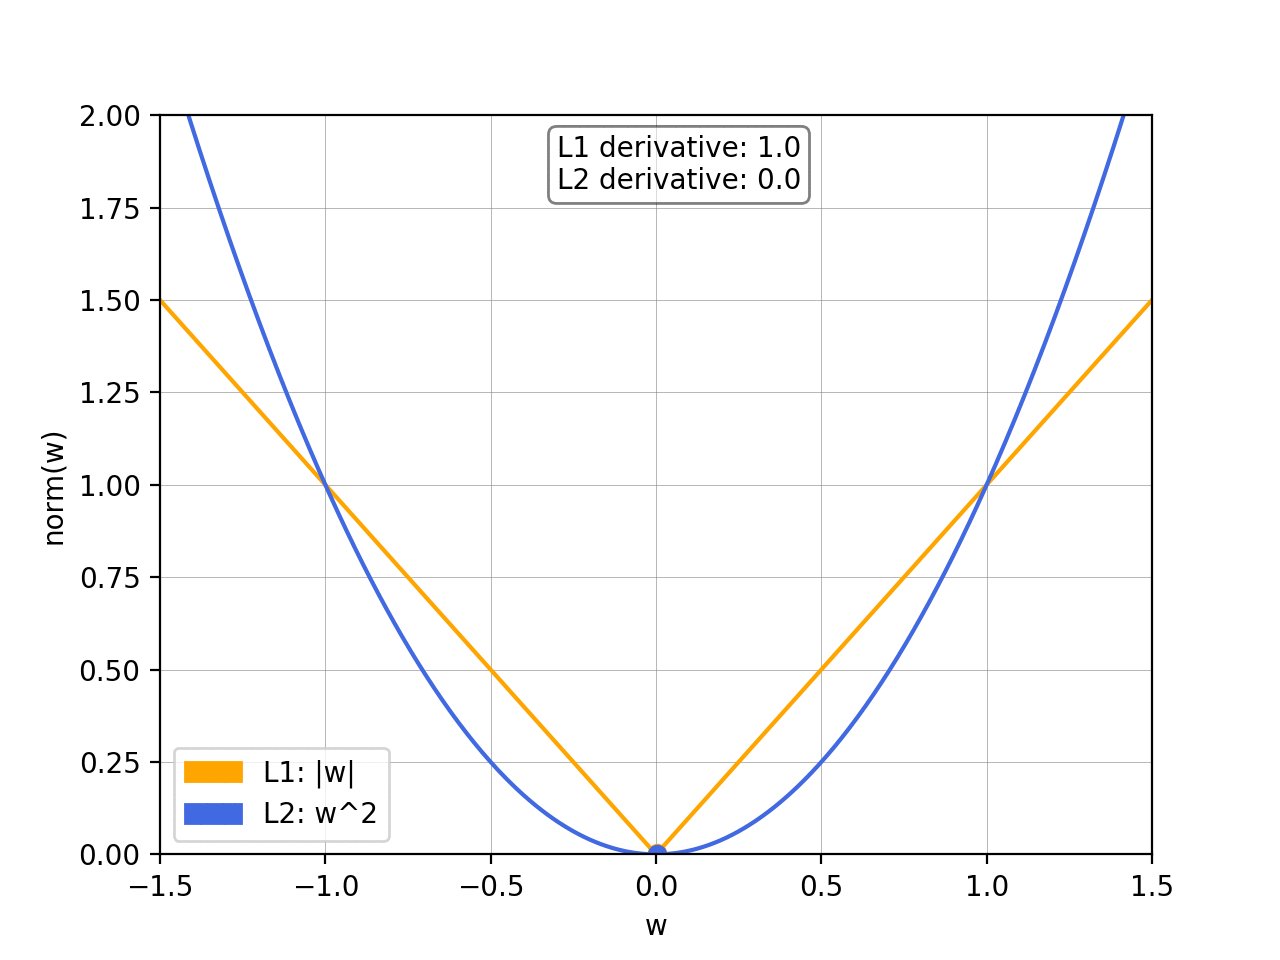
If you’ve taken an introductory Machine Learning class, you’ve certainly come across the issue of overfitting and been introduced to the concept of regularization and norm. I often see this being discussed purely by looking at the formulas, so I figured I’d try to give a better insight into why exactly minimising the norm induces regularization — and how L1 and L2 differ from each other — using some visual examples.
Prerequisite knowledge
- Linear regression
- Gradient descent
- Some understanding of overfitting and regularization
Topics covered
- Why does minimizing the norm induce regularization?
- What’s the difference between the L1 norm and the L2 norm?
Recap of regularization
Using the example of linear regression, our loss is given by the Mean Squared Error (MSE):
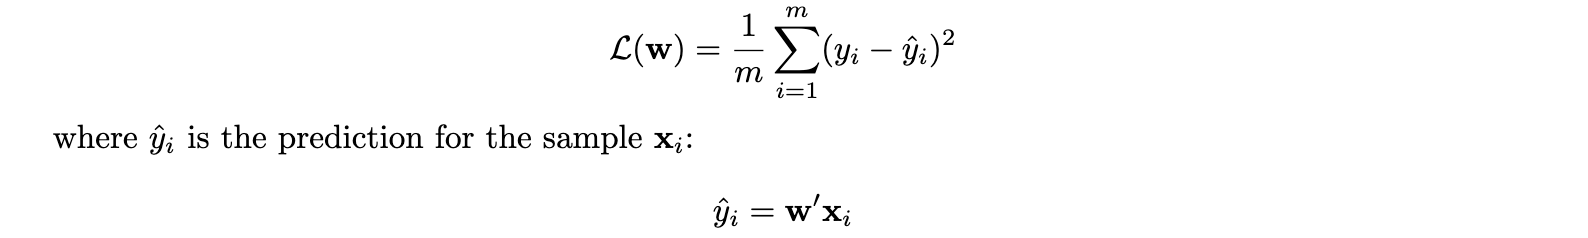
and our goal is to minimize this loss:

To prevent overfitting, we want to add abias towards less complex functions.That is, given two functions that can fit our data reasonably well, we prefer the simpler one. We do this by adding a regularization term, typically either the L1 norm or the squared L2 norm:

#overfitting #data-science #regularization #machine-learning #norms