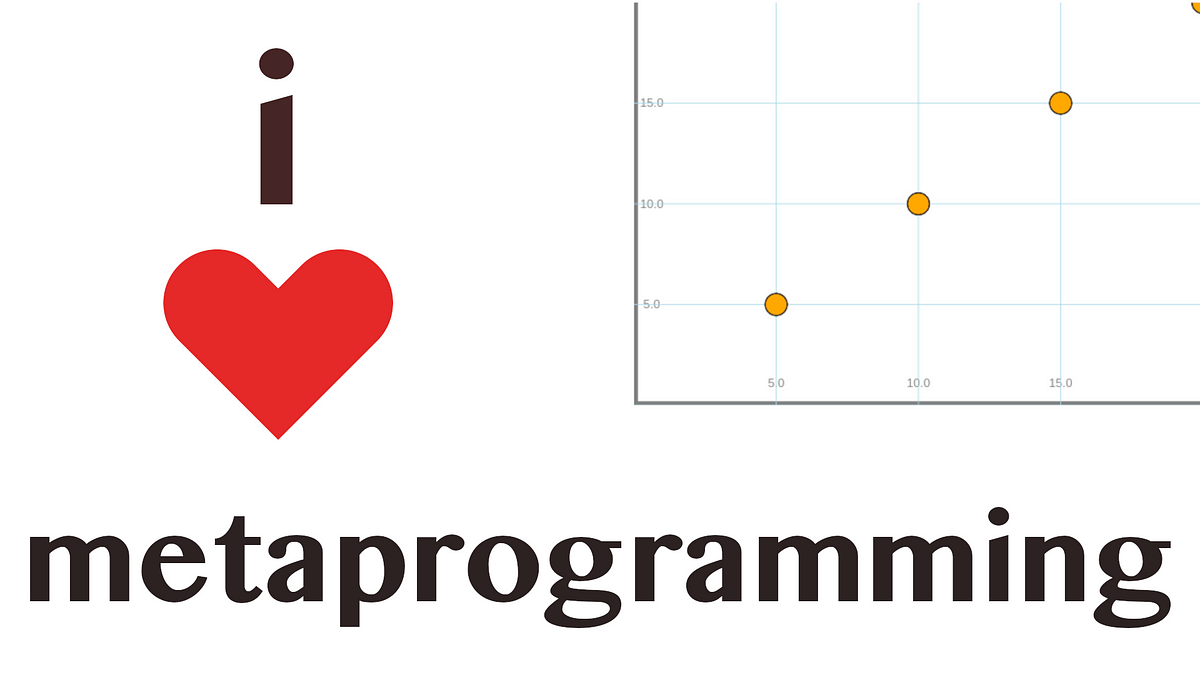
Last time we left off on the work with Hone.jl, a modular, object-oriented graphing library that uses meta-programming to provide an extendable platform, we had run into quite a large sum of issues. Firstly, the grids were drawing incredibly inaccurately, making them virtually useless. This also created an additional blocker in that labels cannot be added to such a grid. Our resulting plots looked something like this:

Additionally, although the points were lining up correctly with our coordinates plotted, they were certainly not lining up with our axis and grid. This is because the origin point of Compose illustrations is not where a Data-Scientist would typically think that the origin point of their graph would be. Instead, the origin of the Y axis is actually in the top left-hand corner. As a result, a point plotted for example at (5,5) would be in the top left rather than the bottom left.
Another thing that I wanted to dramatically alter about Hone is the entire way that plots are assembled. Previously, meta-expressions would be thrown together and parsed in a long and messy meta-programming mess. I wanted to change this. The entire idea of Hone revolves around being modular. In a pinch, you should easily be able to add a different grid from somewhere else, or even run a different coordinate parser for some different results. However, with the way the scatter functions are now this is simply not possible.
#data-science #programming #julia #big data