Like any good story arc, we’ve come a long way since the origins of data analytics. The first phase of BI started with rigid, IT-owned systems. The second phase followed a wave of more flexible, business-oriented tools that enabled a more business-facing Data Analyst mindset — and a tsunami of pretty, easy to filter, but still static dashboards.
Today — with the rise of cloud-native data warehouses and advancements in scalable inference methods — we’re at the cusp of a third phase that not only affords better, faster processing of data, but also lets operational data analysts impact business decisions like never before. I call this phase Data Analyst 3.0.
A brief history of Data Analytics
Before we look at the factors bringing in Data Analyst 3.0, let’s take a look at how far we’ve come. It used to be that a single person within the IT team could gain all the relevant domain and technology skills necessary to become a “data expert.” Data wasn’t big or wide, which meant that people could obtain new data skills (Excel, lightweight SQL, SAS, etc.) as problems arose, and the process of sending over a CSV to answer questions worked just fine.
But, from the organization’s perspective, most data requests failed in the handoff between IT and the business because technologists didn’t know how to make their data infrastructure consumable to an everyday Excel user. The queries that IT teams could deliver only answered a single question about a specific KPI. This had two major issues:
- One question, one answer. The single-answer nature of these inquiries prevented the kind of iterative questioning most business users depended on before taking action. In the 1.0 IT model, this meant every new question required getting back in line and waiting, to the point where people stopped asking questions altogether.
- A chasm between data and decision-making. The people with business knowledge could not get involved in the data exploration process, which is where all of the discoveries happen. So, all you got were rolled-up KPIs but no “ah-ha” moments.
Fortunately, this system has largely disappeared over the last ten years alongside the rise of more business-centric data modeling, BI, and visualization tools. Think Qlik, Tableau, and Looker: the second wave of BI, and the preferred tools of Data Analyst 2.0.
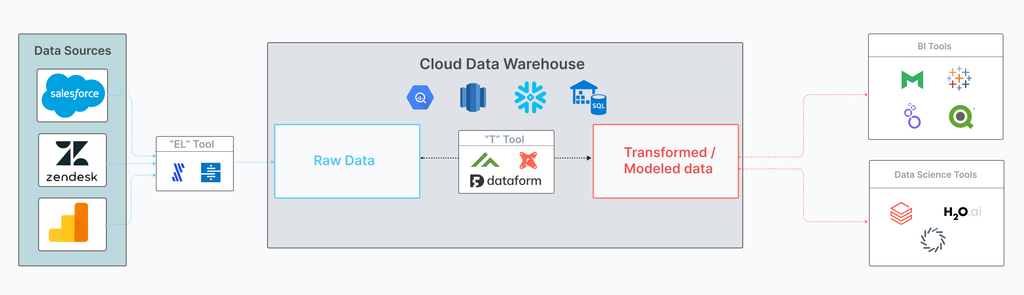
Beneath these end-user tools, this second wave is supported by several platforms that make it easier to derive value from the vast amounts of data we’re storing. Collectively, these tools make up a typical analytics stack.
Typical analytics stack of BI’s second wave
The exact evolution of this analytics stack is a fascinating topic, but I’ll save it for another post.
To navigate and maintain this stack efficiently, businesses needed more than just the IT team, so a few common roles emerged:
- Data Engineers who are responsible for preparing data. This means loading data from disparate sources into a data warehouse and then transforming that raw data into transformed tables that are useful for analysis by Analysts and Data Scientists.
- Data Analysts who are responsible for answering expected (reporting) and unexpected (diagnostic) business questions.
- Data Scientists who use statistical algorithms and ML techniques to solve focused business problems (“what if”).
One way that you can think about the distinction in these roles is whether they act before or after the data is collected. Data Engineers are responsible for operations before the data is collected (and transformed), while Analysts and Data Scientists are responsible for operations after the data is collected.
#data #ai #analytics #bi #analyst #data analysis