Background
Have you ever got tired to select a stock by looking at more than hundreds of financial ratios ? Or have you felt bored on polishing your technical analysis skills or improving your time series model to make better price prediction ? If the answer is YES, you have come to the right place.
In this article, we will go though an experiment to see whether financial ratios in different dimensions really add value to stock selection. During the process, we would also see how cluster analysis helps us to get rid of the sea of financial metrics.
Before that, I am also going to show you the procedures to (1) download historical financial ratios of stocks, and (2) daily price data of stocks, which could be very useful for many of you playing around stock data in different projects.
For the originals of all the codes below, you may refer to my Github link here.
(1) Download financial indicators of stocks
First, we would use a library called FundamentalAnalysis. For the details of this library, please refer to the website here.
To be able to use this package, we need an API Key from FinancialModellingPrep, and follow the instructions there to obtain a free API Key. Please note that these keys are limited to 250 requests per account though there is no time limit. So I strongly recommend all of you to output the downloaded data as excel file for further use. Otherwise, the limitation is easy to exceed.
And due to this limitation, I set the scope for stock selection in the experiment as 97 stocks listed below, which are all components of Nasdaq 100 Index.
The above codes would generate two excel files, (a) key_metrics.xlsx, and (b) financial_ratios.xlsx, with each stock in a separate sheet. Both files store various financial indicators for the past 10–20 years, depending on when the companies are listed. We will combine them together with the returns and price volatility data in later step.
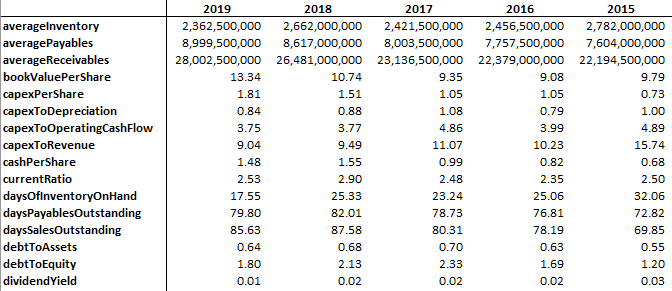
A captured image of key metrics data of MSFT
(2) Download stock price data
N
ext, let’s download the price data. Since the above package has limitation on requests quota, we would switch to another free library yfinance.
The above code would download the daily price data for all the stocks in the ticker list. And close price is selected to represent the price and is outputted as an excel file, price.xlsx.
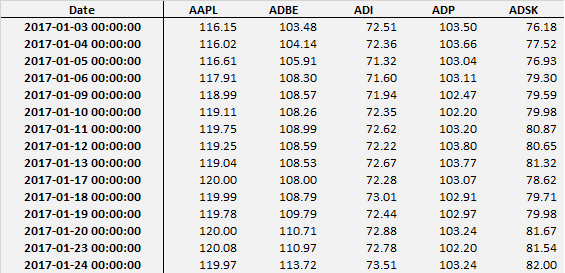
A captured image of price data
(3) Combine all the data for use
At
last, we would like to combine the three excel files prepared into a single file, each for one year in the selected period (2017–2019). I am not planning to go through the details here, since all are just some basic skills using pandas and numpy. For the original code of this section, please refer to **_cluster_stocks_data.py _**in the Github link here.
Nonetheless, I would like to mention some key tricks that are quite useful and applicable even when you are working on other projects.
(a) dataframe.at[index, column name]_ — instead of getting confused about iloc or loc or any other similar functions, you may try the function **“.at”**,_which directly refers to a single cell within the dataframe. And you can easily set its value with an equal sign.
(b) dataframe.T_ —transpose the dataframe if you want to swap the row and column. By applying this function **“.T”**, column name will then become index, and vice versa._
_© pd.concat() _— combine two dataframes in parallel (horizontally).
(d) dataframe.fillna(value=N)_ — fill the cells with NaN with a specific value._
After going through tedious procedures, the end products would be three excel files (2017, 2018 and 2019). Each stores the data of returns, price volatility and other financial indicators for every stock in the ticker list in a specific year.
#cluster-analysis #portfolio #data-science #stock-market #finance #data analysis