Data dashboards — Tooling and libraries
Nearly every company is sitting on valuable data that internal teams need to access and analyze. Non-technical teams often request tooling to make this easier. Instead of having to poke a data scientist for every request, these teams want dynamic dashboards where they can easily run queries and see custom, interactive visualizations.
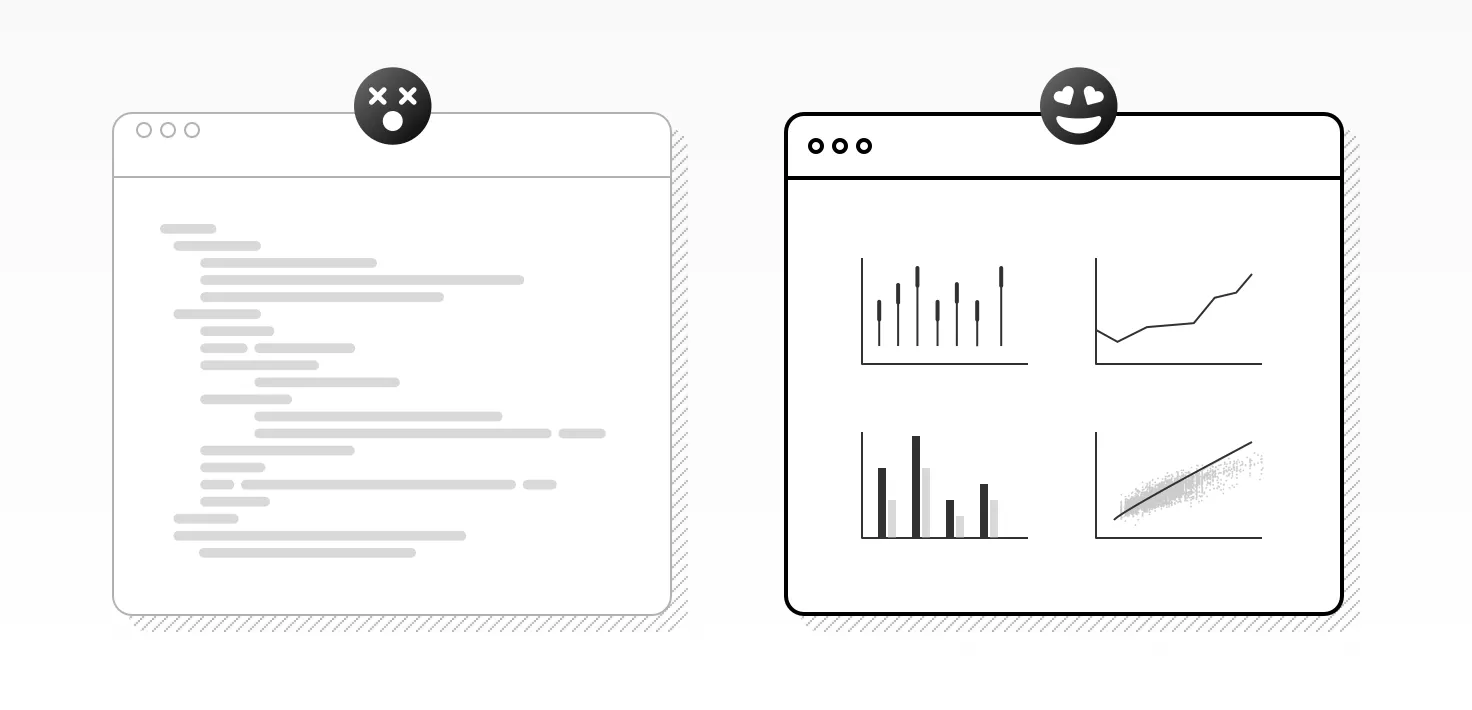
Data dashboards can make data more accessible to your non-technical teams. Source: Author
A data dashboard consists of many different components. It needs to:
- **Analyze: **Manipulate and summarize data using a backend library such as Pandas.
- **Visualize: **Create plots and graphs of the data using a graphing library such as Bokeh.
- **Interact: **Accept user input using a frontend library such as React.
- **Serve: **Listen for user requests and return webpages using a web server such as Flask.
In the past, you’d have had to waste a significant amount of time writing all the “glue” code to join these components together. But with newer libraries like Streamlit and Dash, these components come in a single package.
Still, figuring out which library to use can be challenging. Here’s how they compare as well as some guidance on how to choose which one is best for your project.
[Do you want more detailed tooling comparisons that cut through the marketing-speak? Sign up to our weekly newsletter.]
Just tell me which one to use
As always, “it depends” — but if you’re looking for a quick answer, you should probably use:
- **Dash **if you already use Python for your analytics and you want to build production-ready data dashboards for a larger company.
- **Streamlit **if you already use Python for your analytics and you want to get a prototype of your dashboard up and running as quickly as possible.
- Shiny if you already use R for your analytics and you want to make the results more accessible to non-technical teams.
- Jupyter if your team is very technical and doesn’t mind installing and running developer tools to view analytics.
- **Voila **if you already have Jupyter Notebooks and you want to make them accessible to non-technical teams.
- **Flask **if you want to build your own solution from the ground up.
#streamlit #machine-learning #data-science #jupyter-notebook #big-data
