Dataset Background
Hello everyone. Hope you’ve been well. Today we’ll be looking into how to use Databricks notebooks and Tableau to analyze and visualize data. I’m using the open dataset from Kaggle about New York City Airbnb data from 2019. Kaggle is a great place to find open data sets and practice. Now, why did I choose a dataset from Airbnb in NYC? I lived in NYC for 5 years, so here are a couple of facts that made me select this one to be a great practice project.
New York is the most populous city in the USA, with an estimate of a bit over 8.3 million people. The city is composed of 5 boroughs, which are Brooklyn, Manhattan, Queens, Staten Island, and the Bronx. Since 2008, guests and hosts have used Airbnb to expand on traveling possibilities and present a more “local” way of experiencing the world. After pointing these facts, let’s get started and see some data.
After downloading the data from Kaggle into my notebook, I took a peek into the data and created some questions to analyze the data. But hey! This dataset is not perfect, so before we start analyzing and answering some questions we first need to clean a little bit of the data. I added some missing information i.e. connected neighborhoods with boroughs. Now, that everything is set-up, we can start writing some queries and get some answers.
Takeaways
First I did a warm-up query and answered this question, What is the borough with the most listings?
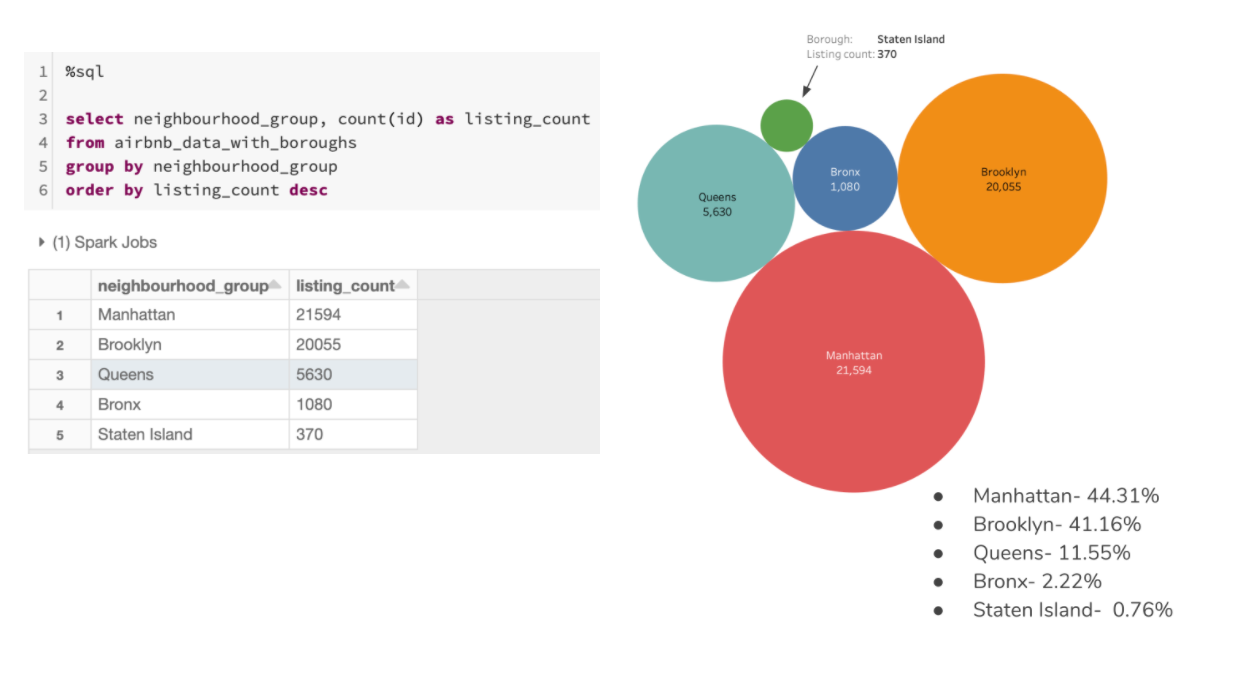
As you can see, Manhattan is the borough with the most listings.
But, what is the borough with the most concentration of hosts?
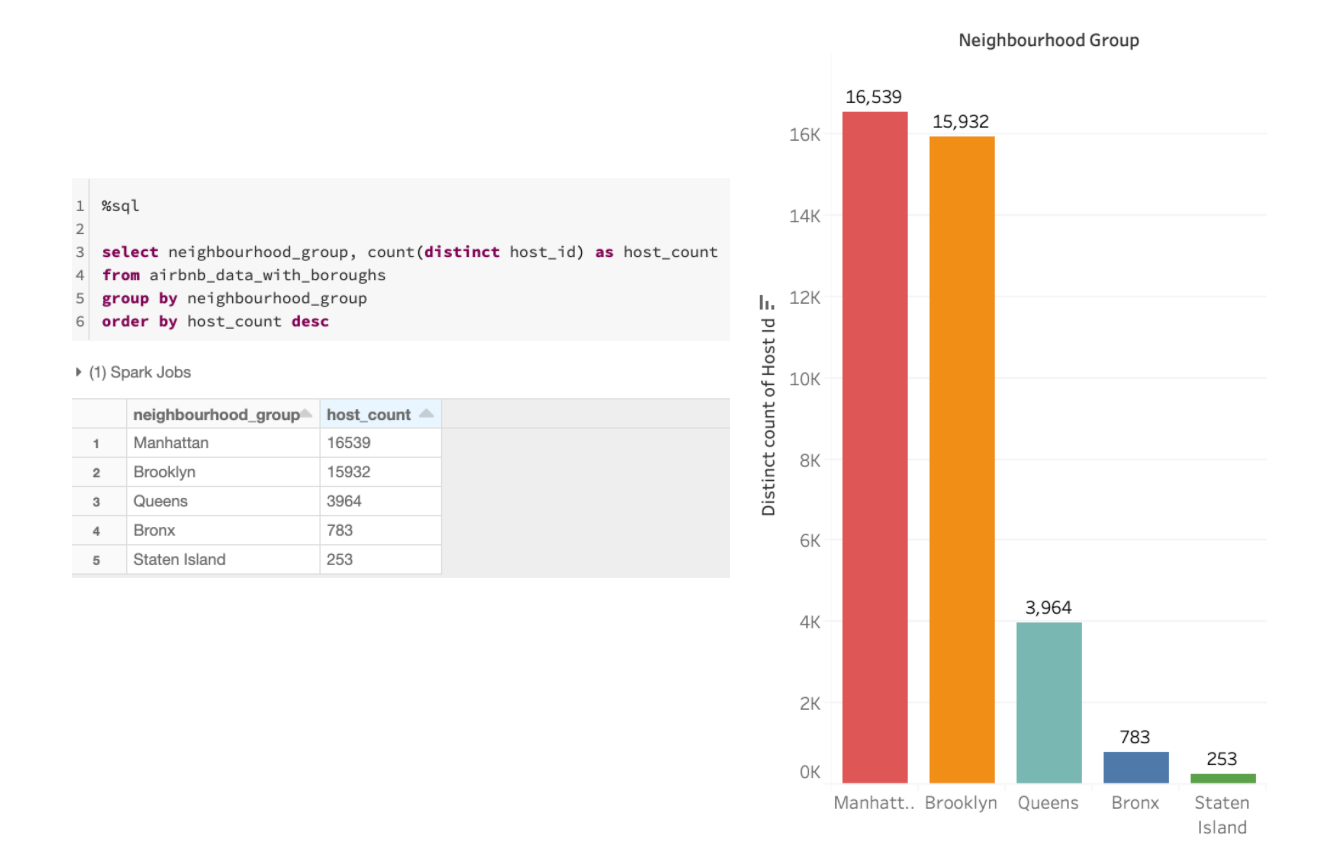
Again its Manhattan.
Now, let’s see what is the room type most listed.
#data-analysis #databricks #python #tableau #data-visualization #data analysis