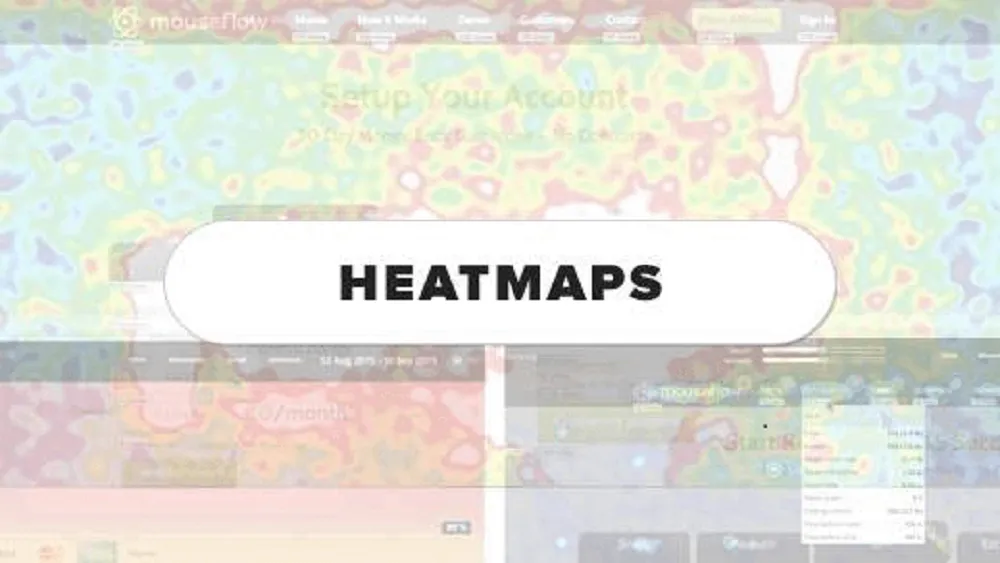
Statistics is an analysis of data that represents numerical values with graphical presentations. A heatmap is a kind of statistical data presentation that appears in the form of colours. As the name suggests, a heatmap reveals data variations in colours that carry a resemblance with heat signatures. The extremities in values are expressed with contrasting colours. Such a graphical and statistical data chart provides a piece of more comprehensive information. Marketers and businesses need such data to introduce the necessary changes in their profession and increase sales. Commercial organizations can obtain a summarized version of their elaborate reports through heatmaps.
Read More: Five Best Heatmap Tools for SEO: Analysis and Comparison

1.05 GEEK