Exploratory Data Analysis (EDA) is one of the most important aspect in every data science or data analysis problem. It provides us greater understanding on our data and can possibly unravel hidden insights that aren’t that obvious to us. The first article I’ve wrote on Medium is also on performing EDA in R, you can check it out here. This post will focus more on graphical EDA in Python using matplotlib, regression line and even motion chart!
Dataset
The dataset we are using for this article can be obtained from Gapminder, and drilling down into _Population, Gender Equality in Education _and Income.
The _Population _data contains yearly data regarding the estimated resident population, grouped by countries around the world between 1800 and 2018.
The Gender Equality in Education data contains yearly data between 1970 and 2015 on the ratio between female to male in schools, among 25 to 34 years old which includes primary, secondary and tertiary education across different countries
The _Income _data contains yearly data of income per person adjusted for differences in purchasing power (in international dollars) across different countries around the world, for the period between 1800 and 2018.
EDA on Population
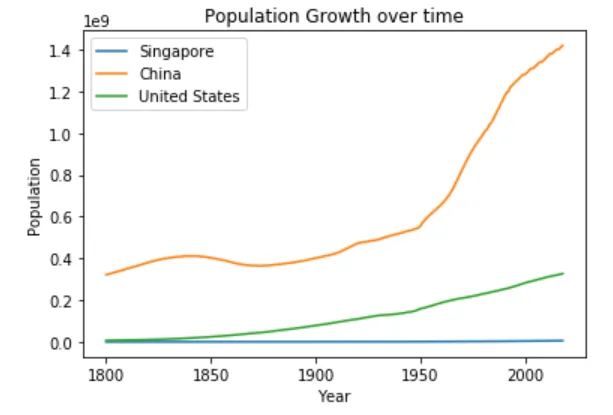
Let’s first plot the population data over time, and focus mainly on the three countries Singapore, United States and China. We will use matplotlib library to plot 3 different line charts on the same figure.
import pandas as pd
import matplotlib.pylab as plt
%matplotlib inline

## read in data
population = pd.read_csv('./population.csv')
## plot for the 3 countries
plt.plot(population.Year,population.Singapore,label="Singapore")
plt.plot(population.Year,population.China,label="China")
plt.plot(population.Year,population["United States"],label="United States")
## add legends, labels and title
plt.legend(loc='best')
plt.xlabel('Year')
plt.ylabel('Population')
plt.title('Population Growth over time')
plt.show()
#exploratory-data-analysis #data-analysis #data-science #data-visualization #python