A walk-through of a case study to visualize the growth of Covid-19
Since first being recorded late December 2019 in China, COVID-19 has spread around the world and been declared a pandemic by the World Health Organization. Because of this, billions of persons have been sent into lockdown as health services struggle to cope. Now, in August 2020, there are many questions as to whether students should go back to school in-person for the new semester, whether businesses like restaurants can resume regular operations, and whether countries should reinforce their previous lockdown measures.
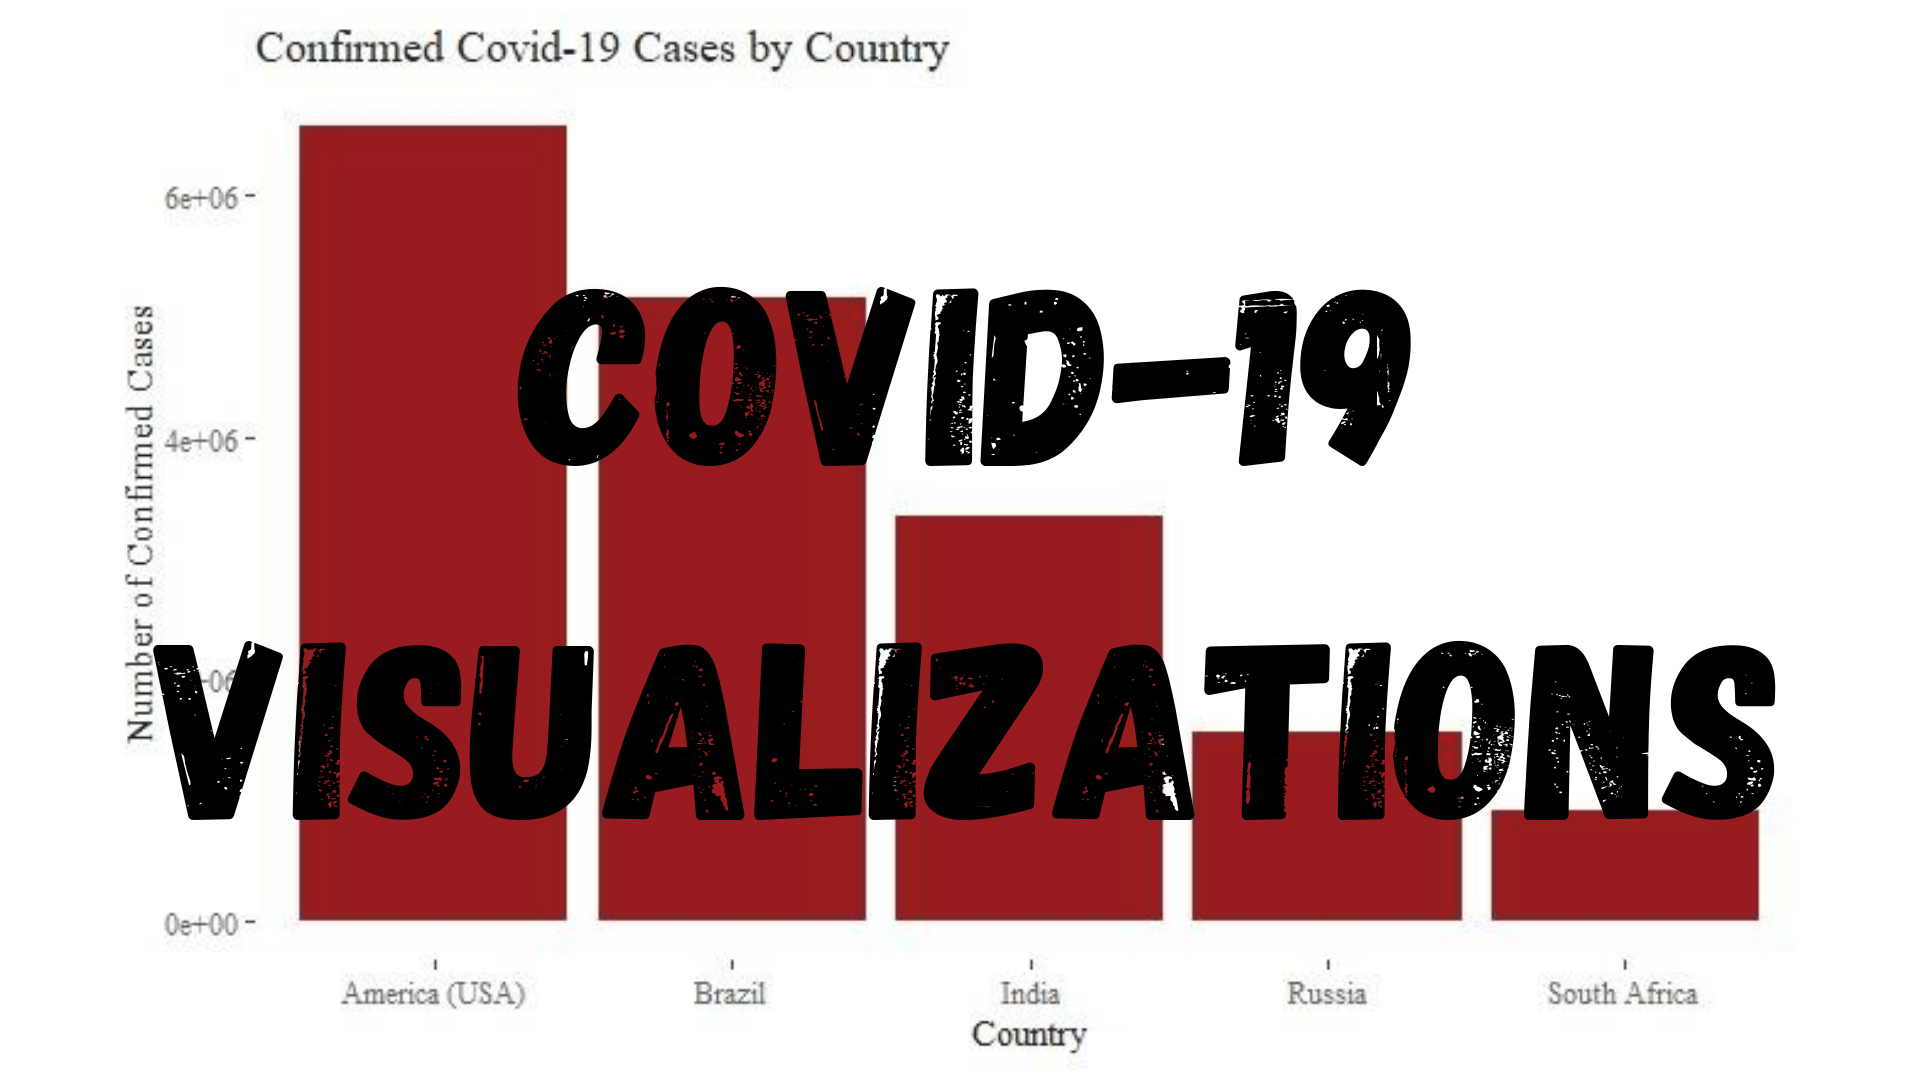
Many of these decisions need to be guided by both data healthcare professionals and should not be made in a vacuum, absent of data. There are many aspects to the data analysis process, and data visualization is a very important aspect. Data visualization is the process of taking information and transforming it into a visual context, such as a graph. Most persons tend to agree that looking at a graph and understanding the underlying message is much easier than reading through a table of numbers, especially with large data sets. Therefore, in order to understand the distribution of COVID-19 cases by country as well as how COVID-19 is spreading throughout these countries, I am going to walk through a data visualization exercise.

All analysis will be conducted in R using the tidyverse and the data can be retrieved from a publicly available data repository (link in the Reference section).
library(tidyverse)
library(ggthemes) ## contains the theme used for the graphs
The first step is to load the data into my environment and ensure that it is structured appropriately for visual analysis.
covid_df <- read_csv('file_path'+'file_name')
glimpse(covid_df)
This data set contains variables such as the date, country, province, longitude, latitude, the number of cases on a given date, and whether those cases were confirmed positive cases, recoveries or deaths. For this analysis, I am interested in the date, country and number of confirmed positive cases. Therefore, I will select these columns and create a new data frame with only the variables of interest.
However, upon inspection of the output from glimpse(covid_df) , it is found that the date variable was parsed as a character type instead of a date type, and the type of case was also parsed as a character whereas it should have been a factor. Thus, I will convert the variables to the appropriate data type and then create the new data frame.
#data-visualization #towards-data-science #programming #data-science #covid19 #data analysis
