Hi everyone, Ardi here! In this article I wanna do Exploratory Data Analysis (EDA) on Titanic dataset. So far, I’ve been doing several projects in which most of those are related to classification on unstructured data (i.e. image classification). Today, instead of doing the similar project, I wanna try to work with structured data which I think this one is more related to the field of data science in general. Here I decided to use Titanic dataset. The main goal of working with this bunch of data is to perform prediction whether a passenger was survived based on given attributes that they have. The dataset itself can be downloaded here. It should not take long as it only consists of some tiny csv files.
Now after the download finishes we can start to write some code. As usual, I will begin with some imports. By the way I use the combination between Matplotlib and Seaborn just because I’ve been familiar with Matplotlib’s codes while on the other hand I like the figure styles of Seaborn better.
import pandas as pd
import numpy as np
import matplotlib.pyplot as plt
import seaborn as sns; sns.set()
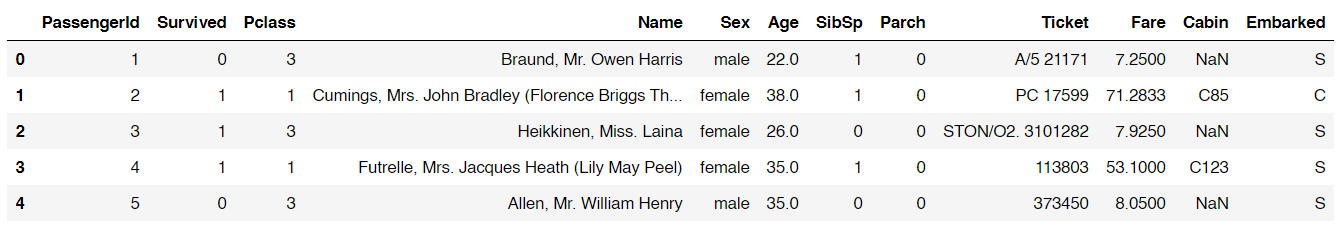
Next, we will load and display the training data. In this EDA I decided not to take into account the data from test set because it does not mention the survival status of the passengers.
df = pd.read_csv(‘train.csv’)
df.head()
#ai #machine-learning #matplotlib #kaggle #exploratory-data-analysis