Introduction
Energy consumption forecasting for buildings has immense value in energy efficiency and sustainability research. Accurate energy forecasting models have numerous implications in planning and energy optimization of buildings and campuses. Good forecasts can help to implement energy-saving policies and optimize operations of various energy-based systems. The results from these energy forecasting models provide us with a baseline to prevent wasteful energy consumption. This article summarizes the experimentation and shares the results of the energy demand forecasting for a building.
Objective
The Objective of the project is to implement time series forecasting models to forecast energy consumption for a building. This is carried out using various features in the dataset such as historical energy consumption (2014–2016), temperature readings at nearby buildings, holidays, and other synthetic features. Our aim is to build a model that will impact energy management systems for the better.
Exploratory Data Analysis (EDA)
Any machine learning model is only as good as the data on which the model was trained. It is vital to understand the data in terms of its distribution, correlation, and other parameters. In the following section, We shall explore each of the parameters used to understand the data.
(1) Time Series and Distribution Plot
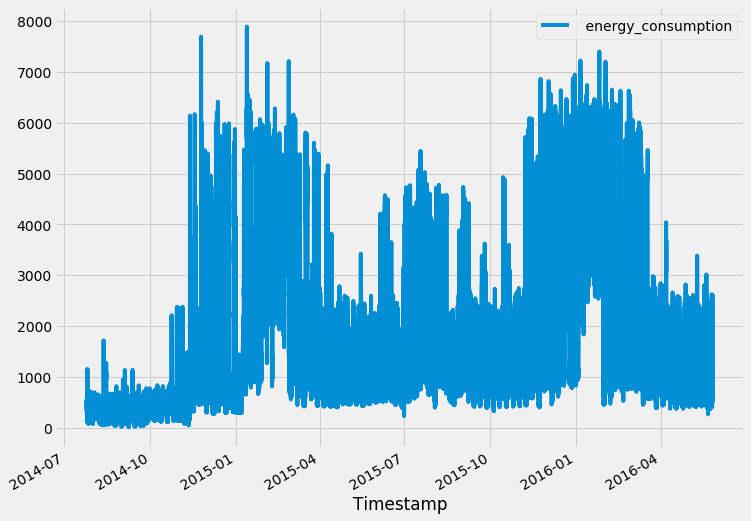
Firstly, to get an overview of the given data, we plotted the time-series plot with** energy consumption along the y-axis** and **timestamp along the x-axis. **The graph looks periodic at first-sight (further elaboration in later sections).
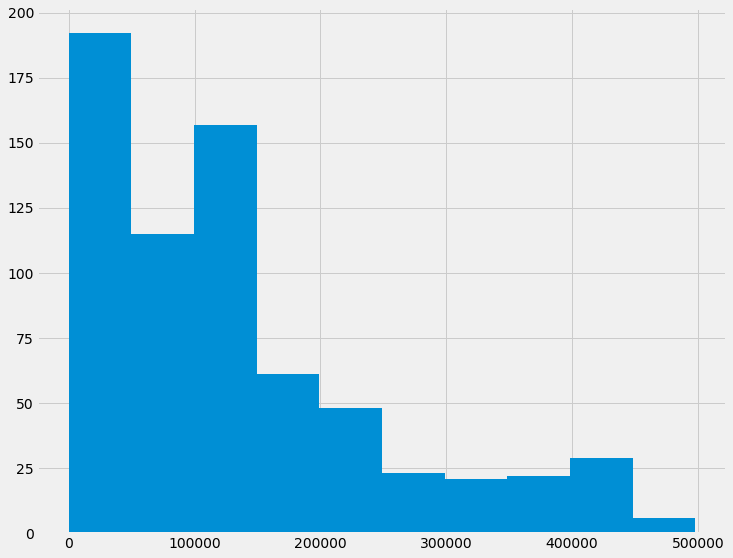
Next, we plot the distribution graph of energy consumption and it is evident that the **data is not normally distributed. **It is important to note that making the input data normally distributed helps the model learn much faster.
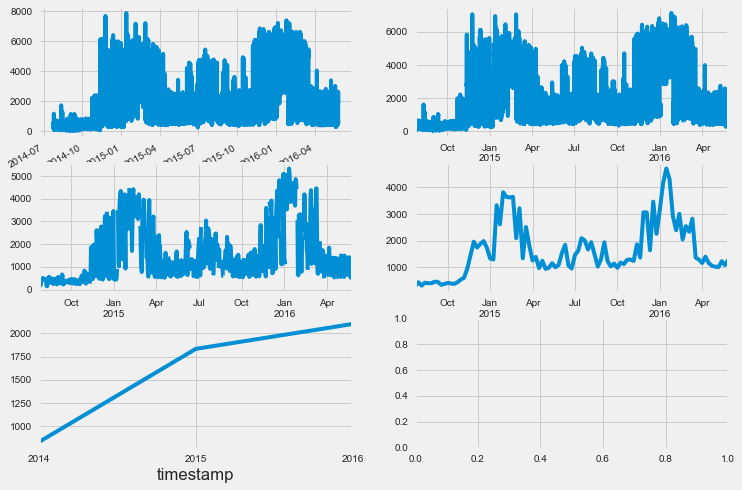
To extend the time-series visualization, We resampled the given data (**originally sampled at an interval of 15 mins) **at1 Hour, 1 Day, 1 Month, and 1 Year. The first plot shows the original data (15 Mins) and the following plots show the resampled data at the respective intervals.
(2) Energy Consumption Plot On an Hourly Basis
To study the distribution of energy consumption, we group the data on an hourly and daily basis. This grouped data were visualized using heat maps.
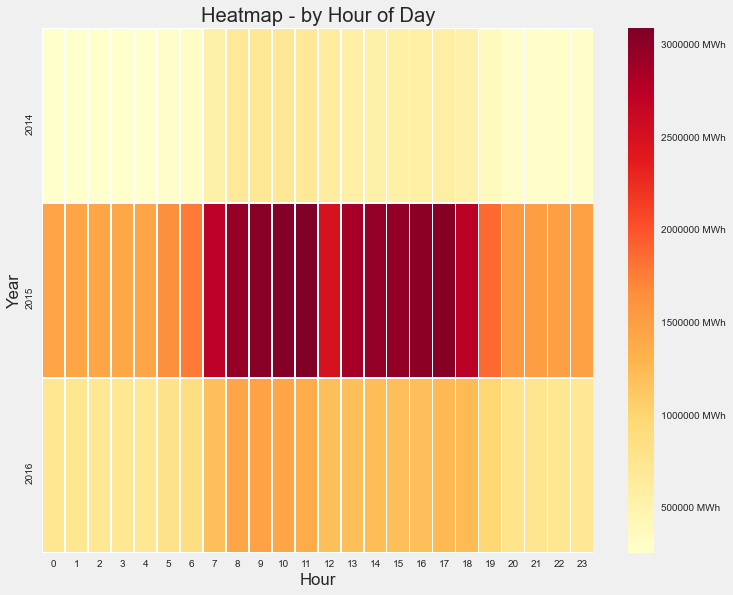
We can infer from the heatmap that energy consumption has relatively high values from 7 AM till 6 PM in the hourly plot. The same is true from **Monday (dow=0) to Friday (dow=4) **in the daily plot. So these are potential features that could be used as input to train our model.
#deep-learning #machine-learning #data-science #deep learning