In this article, we will be going through the stock prices of a certain company. **However, this article does not encourage anyone to trade ONLY based on this forecast. Stock prices are dependent on various factors like supply and demand, company performance, the sentiment of the investors, etc.What is Time-Series?Time Series comprises of observations that are captured at regular intervals. Time Series datasets have a strong temporal dependence. It can be used to forecast future observations based on previous ones.Decomposing the Time Series:The Time-Series can be divided into several parts as follows:Trend:**The increase or decrease in the value of the data. This can further be divided into the global trend and local trend.
_Seasonality: _It is the repetitive pattern that is visible in the series. This rise or fall in the values of the data is of fixed frequency. For example, the sales of Christmas trees are always greater during December and less for the rest.Cyclicity: It is the rise and fall in the value of the data which is not of a fixed frequency. It can be seen as an outcome of economic conditions or other external factors**_Noise: _**It is just some random data that we obtain after extracting the trend and the seasonal components from the time series.The components of the time series can be an additive or multiplicative version. The multiplicative model is preferred when the magnitude of the seasonal pattern increases or decreases with the increase or decrease in the data values. The additive model is preferred when the magnitude of the seasonal pattern does not correlate with the data values.
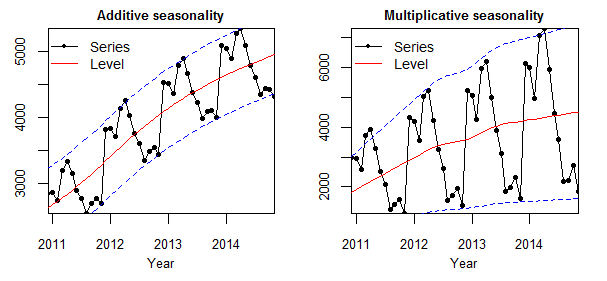
Additive and Multiplicative Seasonality
In the additive version, the magnitude of the seasonal pattern remains to be uncorrelated with the rising trend whereas it is increasing with the increase in the trend of the time series in the multiplicative version.
How to obtain stock price data?
We can obtain stock prices by creating an API request using the requests package. We can also use the quandl package which is designed to provide financial and economic data.We will extract the prices of US stocks from alphavantage website by creating an API call. Using the code snippet below, we have extracted the daily stock prices of IBM. You can refer to this link to alter your request needs.
For using quandl package to import data into python, you might need to install quandl package. Enter the command **!pip install quandl **in your Jupyter notebook and you’re good to go. We have imported the prices of Infosys (BOM500209) and will use these for our further analysis. More documentation on quandl and how to get the best out of it can be found here.
For both the methods, you will need to create an API key which you will use to obtain the data. You can easily get your API by clicking these links: alphavantage and quandl.Now that we have got the data, we need to plot it to get an overview of how the trend looks like.
#time-series-analysis #analytics #data analysis