Have you ever been reading a news article where, halfway down the page, you come across a beautiful graphical representation of whatever the article is discussing? It’s perfect- it’s a geographical map, and the darkness of shading in certain regions corresponds to the presence or strength of a particular statistical trend in that area. You think to yourself, “Wow, that’s neat. I truly understand why they say a picture is worth a thousand words. Because this article just spent five minutes of my time telling me about something I could’ve gleaned from this graphic alone. Powerful. I bet you have to be some sort of math wiz or computer genius to figure out how to make one of those.”
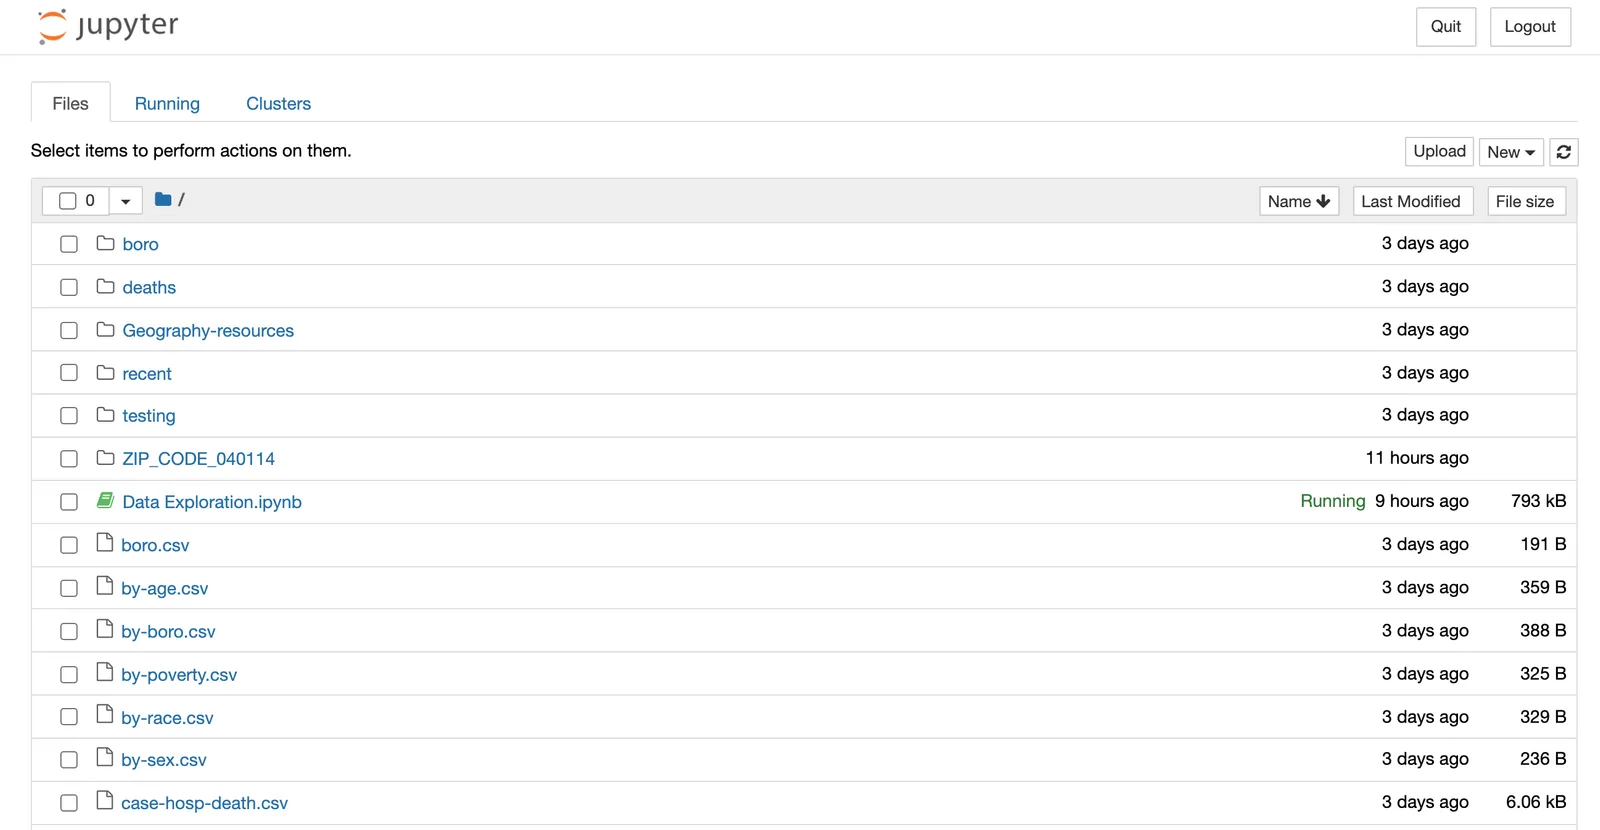
I’m happy to tell you a couple things about this moment. First, I totally agree with you; these graphs are neat. They’re called chloropleth graphs, and they can pack such an informational punch. You probably see these more often than you realize (we’re in the thick of election season here in the United States, so I feel like I’m bombarded with them multiple times per week). And second, you do not need to be a master of computers to make one; they’re in fact pretty easy to construct with some basic Python skills. For the rest of the blog, I’ll be showing you how to make one such graph so you can impress all your friends. This guidance will assume you have a base understanding of Python and the Pandas package (although if you don’t, really all you need to know how to do is open a Jupyter notebook from your computer and navigate to file folders with your computer terminal; you could theoretically just copy and paste the rest).
#data-science #python #choropleth-map