People who smoke are 15–30x more likely to get lung cancer. Black men and women are 1.9x more likely to die from a COVID-19 related reason than their white counterparts.
Chances are, you’ve seen one of these “x times more likely” claims on a headline or in a newspaper article. While many of these figures are well researched and informative, there are definitely sources that use odds ratios for sensationalism and fear mongering (i.e. This is Where You’re 19 Times More Likely to get Coronavirus 🙄). Today, I will give you a brief overview of what these statistics are, how to calculate them, how to interpret them, and discuss some drawbacks.
What are these statistics?
These statistics are called odds likelihood ratios, and they are often used to describe how certain populations are more or less likely to experience something. Some benefits of odds ratios are that they are easily interpretable by a wide audience (i.e. 2x means more to most people than 0.7 regression coefficient), and can highlight the effect of a single variable across 2 populations (i.e. rates of cancer across smokers and non-smokers).
Odds ratios are sometimes confused with probability (i.e. 10 – 15% of smokers are diagnosed with lung cancer), but they are not the same thing. Odds ratios represent how one event is more or less likely than another, while probability represents how likely an event is out of all possible outcomes.
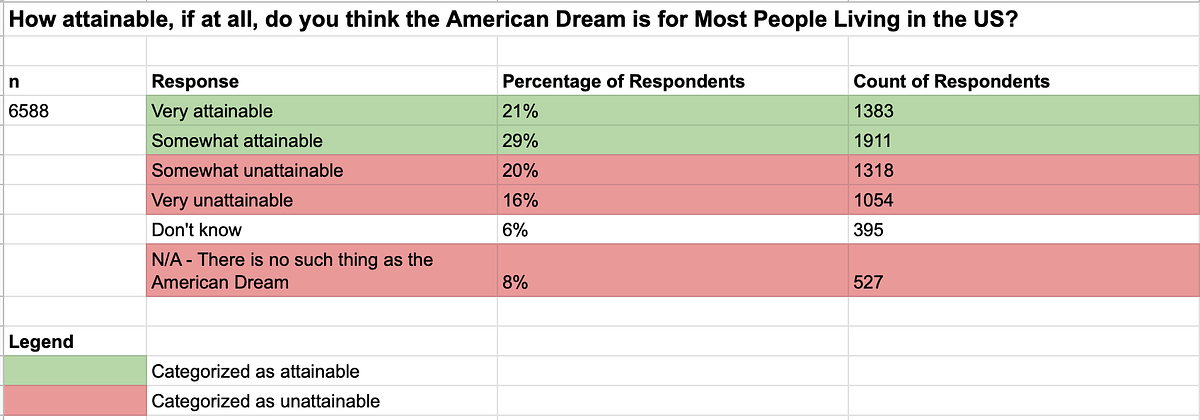
To demonstrate the difference, I will use YouGov’s survey of 6,500+ respondents to understand the likelihood and probability of Americans believing the American Dream is Obtainable (A.D.i.O) for most people living in the US.

Jack never let go, and now he’s Jay Gatsby #upwardMobility. Image from Pinterest
The American Dream is the belief that any American can achieve success and upward mobility through hard work and dedication, regardless of race, social class, or religion. It is one of the foundational concepts of America, and the topic of one of my favorite books — The Great Gatsby!
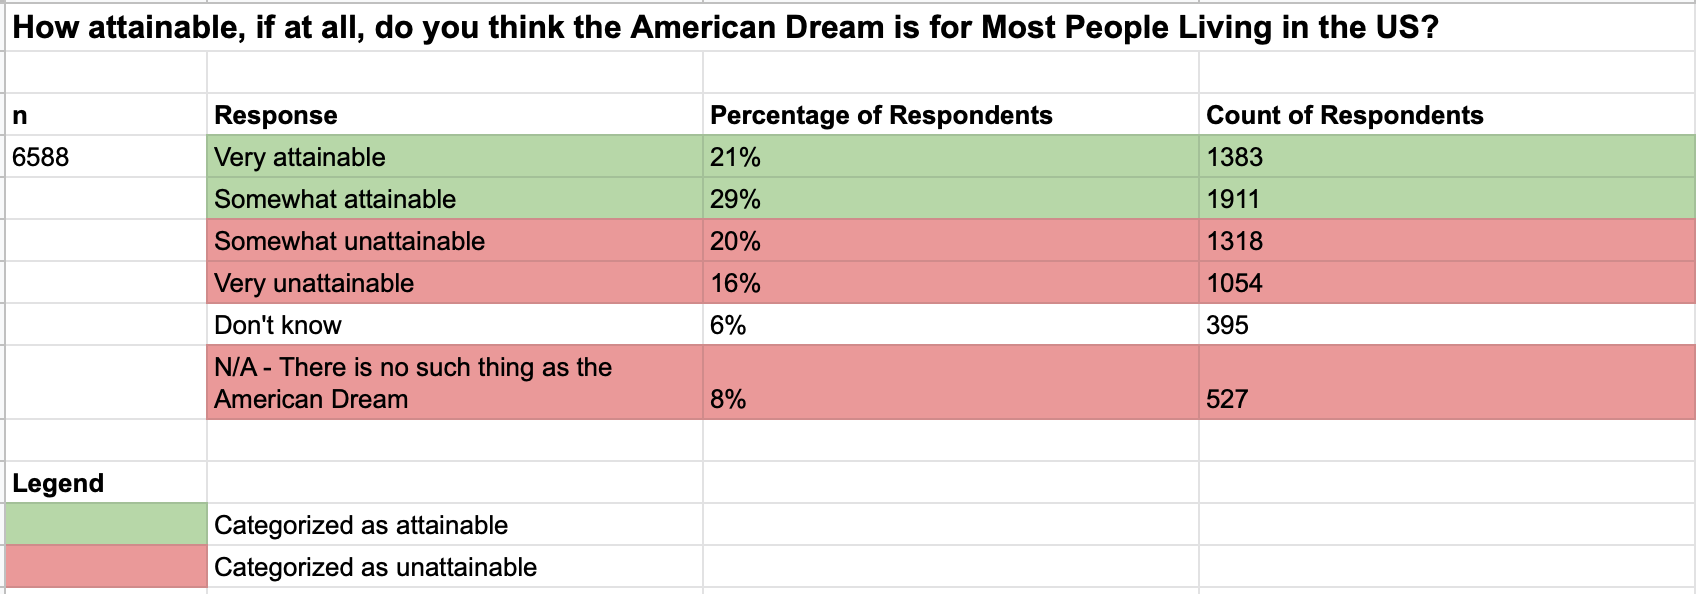
Image by author.
The probability of a respondent thinking A.D.i.O is Total Count of Attainable Responses / All Responses, or (1383 + 1911) / 6588. This works out to be 51%, which means ~1 in 2 Americans think A.D.i.O.
The odds of a respondent thinking A.D.i.O versus not obtainable is Total Count of Attainable Responses / Total Count of Unattainable Responses, or (1383 + 1911) / (1318 + 1054 + 527). This works out to be 1.13, which means that Americans are slightly more likely to think A.D.i.O than not.
The general formula for calculating odds ratio is Event A Occurrences / Event B Occurrences.
#data #journalism #data-science #data-analytics #statistics #data analysis