This article is part 2 in my series detailing the use and development of SAEMI, a web application I created to perform high throughput quantitative analysis of electron microscopy images. Check out part 1 here (where I go over the motivation behind the app) and part 3 here (where I go over how I trained my image segmentation model). You can also check out the app here and its Github here. In this article, I give a walk-through of how to use the app and obtain the best results.
So You Have an Electron Microscopy Image
To start off this article, I am going to assume that you have either seen/taken an electron microscopy (EM) image before or at the very least are familiar with electron microscopes. If not, please check out part 1 in my series where I detail the motivations behind developing this app. Let’s assume, though, that you are a researcher who has taken some EM measurements and now would like to perform some quantitative analysis on your images. More specifically, you would like to determine the mean size of the particles in your image and the standard deviation of that distribution. As an example, let’s say you have an EM image like the one seen in Figure 1 below.

Fig. 1 An example EM image. source: CNR-IOM (CC-BY)
The first thing to note here is the banner that is displayed along the bottom portion of the image which contains information about the measurement such as the scale bar, its electron high tension (EHT) and its magnification. Many electron microscopes and its accompanying software will add this kind of information (at minimum there will be a scale bar) to the image. Unfortunately, since this is part of the image itself, leaving it in may affect the resulting segmentation from the deep learning model.
In order to reduce the potential for error, the additional “meta-information” should be removed from the image whenever possible. Take care to keep a record of the scale bar elsewhere, however, as it will be needed to convert the final calculation from pixels to a physical size in the final step. For now, the “meta-information” can be removed through a number of different methods.
The simplest method and the one I would personally recommend is to just crop it out of the image. It has the least potential to introduce further artifacts and requires the least technical prowess in image processing to perform. The only downside is that you may be losing important data by cropping the image.
In the interest of presenting other options, you can also use some more involved image processing techniques to remove the banner using either the open-cv or scikit-image libraries in Python. Some of these methods include using reflective padding, nearest neighbor padding, and constant padding. An example of all three methods are shown in Figure 2. The region where the banner used to be is highlighted in red in all three examples.
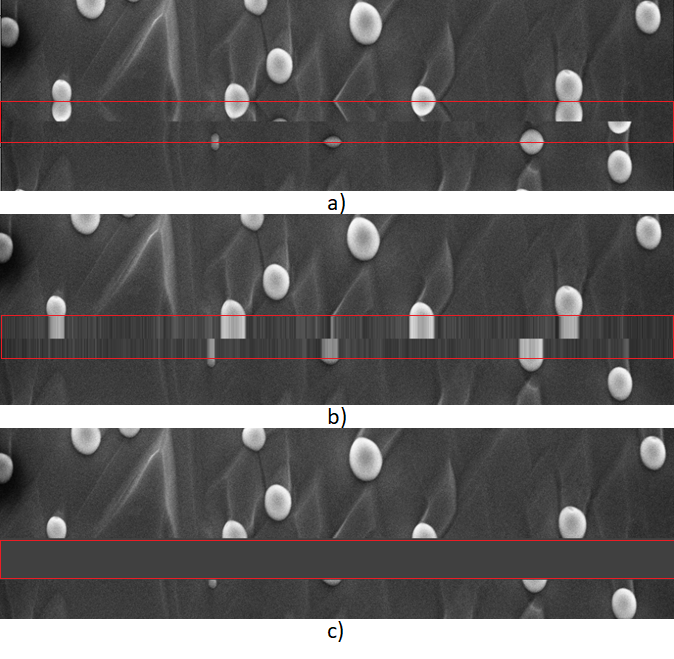
Fig. 2 a) example of removing the banner using reflective padding b) example of removing the banner by using nearest neighbor padding c) removing the banner by replacing it with a constant padding. source: CNR-IOM (CC-BY)
As can be seen, each of these methods can result in unintended artifacts to the image and it is up to you to decide how you would like to deal with the “meta-information”.
#electron-microscopy #data-science #machine-learning #deep-learning #data analysis