Experiments allow you to talk about cause and effect. Without them, all you have is correlation. What is correlation?
IT’S NOT CAUSATION. (!!!)
Sure, you’ve probably already heard us statisticians yelling that at you. But what is correlation? It’s when the variables in a dataset look like they’re moving together in some way.
Two variables X and Y are correlated if they seem to be moving together in some way.
For example, “when X is higher, Y tends to be higher” (this is called _positive _correlation) or _“when X is higher, Y tends to be _lower” (this is called negative correlation).
Thanks, Wikipedia.
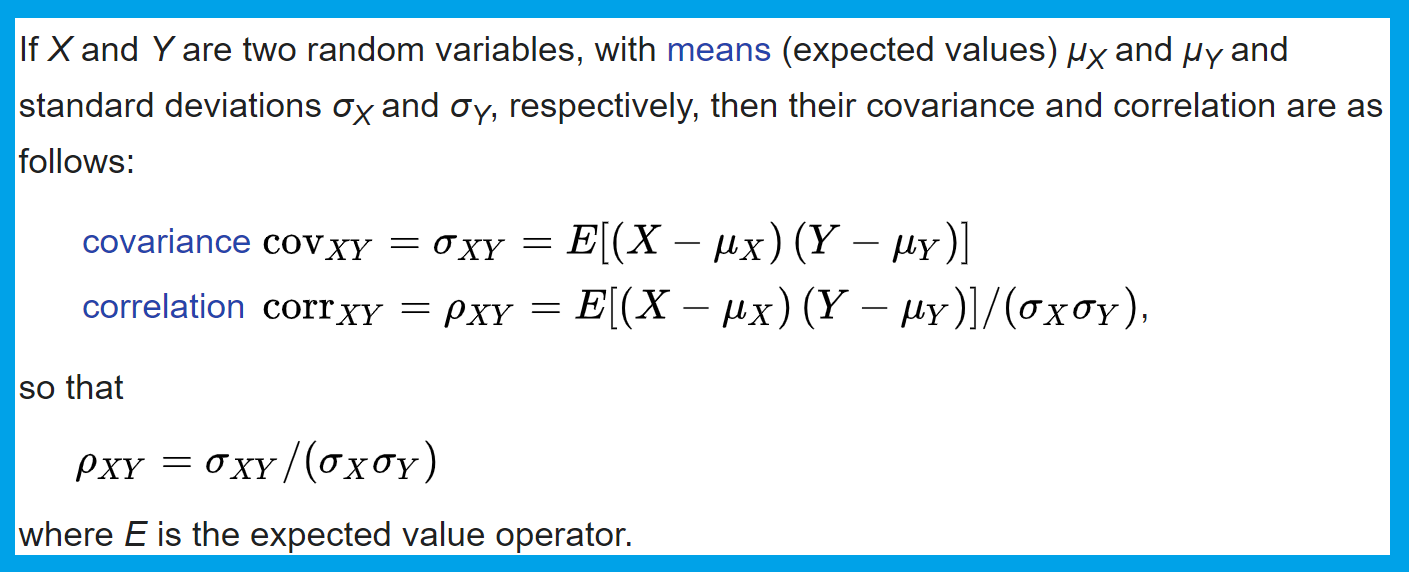
If you’re looking for the formula for (population) correlation, your friend Wikipedia has everything you need. But if you wanted that, why didn’t you go there straight away? Why are you here? Ah, you want the intuitive explanation? Cool. Here’s a hill:
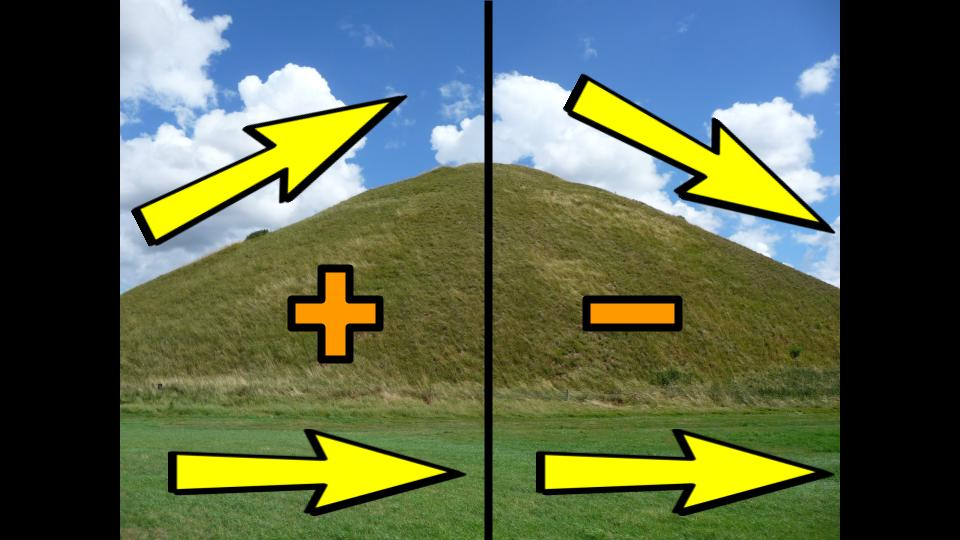
On the left, height and (left-to-right) distance are positively correlated. When one goes up, so does the other. On the right, height and distance are negatively correlated.
When most people hear the word correlation, they tend to think of _perfect _linear correlation: taking a horizontal step (X) to the right on the hill above gets you the same change in altitude (Y) everywhere on the same slope. As long as you’re going up from left to right (positive correlation), there are no surprise jagged/curved bits.
Bear in mind that going up is positive only if you’re hiking left-to-right, same way as you read English. If you approach hills from the right, statisticians won’t know what to do with you. I suppose what statisticians are trying to tell you is never to approach a hike from the right. That will only confuse us.
But if you hike properly, then “up” is “positive.”
Imperfect linear correlation
In reality, this hill is not perfect, so the correlation magnitude between height and distance will be less than 100%. (You’ll pop a +/- sign in front depending on whether we’re going up or down, so correlation lives between -1 and 1. That’s because its formula (pasted from Wikipedia above) divides by standard deviation, thereby removing the magnitude of each variable’s dispersion. Without that denominator, you’d struggle to see that the strength of the relationship is the same regardless of whether you measure height in inches or centimetres. Whenever you see **_scaling/normalization _**in statistics, it’s usually there to help you compare apples and oranges that were measured in different units.)
#technology #data-science #statistics #data analysis