Introduction
Recently, I took an introductory psychology course in my first year of university where among other basic principles of psychology, we were taught about the brain, the ways we can visualize the brain using different kinds of scans, and how doctors use these scans to detect and monitor diseases. It got me wondering- is there a simple way I can visualize and analyze the brain?
A good amount of research led me to the course ‘Introduction to Neurohacking in R’ on Coursera. This course helped me gather the background information and the building blocks needed to visualize the brain using just two things: open-source MRI scans and R. Given Python is generally considered the go-to language for deep learning and image analysis, I wanted to challenge myself to use R and solve the questions I had.
Dataset
I tested my knowledge on a dataset I found on Kaggle called ‘Brain Tumor Progression’. It consists of the MRI scans of 20 patients suffering from Glioblastoma. There are two MRI exams included for each patient taken 90 days apart to monitor the progression of the tumor.
Questions I Answered
Question 1: How do I convert the scans into a format suitable for analysis?
Most hospitals store MRI scan data in a two-dimensional DICOM format where each axial slice of the brain is one DICOM file. This is done to protect health information. To make these images suitable for analysis by R, the first step is to convert DICOM into NifTI format, which combines all the DICOM files into a folder to come up with a 3D image of the brain (the NifTI format!). So say we wanted to take a look at the 11th axial slice of Patient 1’s brain, we get this.

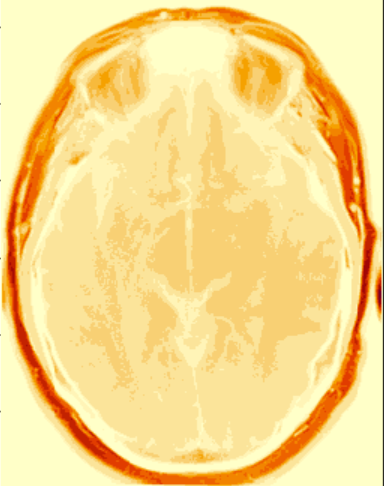
Axial view of the 11th slice of Patient 1’s brain
Question 2: Is there a way to visualize certain tissues/parts of the brain using intensity values?
When I told R to highlight regions of the 11th slice of the brain with intensity values between 300 and 400 (excluding boundary values), it colored all those regions in red like this.


Regions colored in red represent intensity values between 300 and 400
#r #data-science #brain-scan #machine-learning #data-visualization