ASP.NET Core Charts - Rich & Interactive Graphs with Real-time data
Overview
The ASP.NET Core Chart is a well-crafted charting component to visualize data. It contains a rich UI gallery of 30+ charts and graphs, ranging from line to financial that cater to all charting scenarios. Its high performance helps render large amounts of data quickly. It also comes with features such as zooming, panning, tooltip, crosshair, trackball, highlight, and selection.
Why choose Syncfusion ASP.NET Core charts?
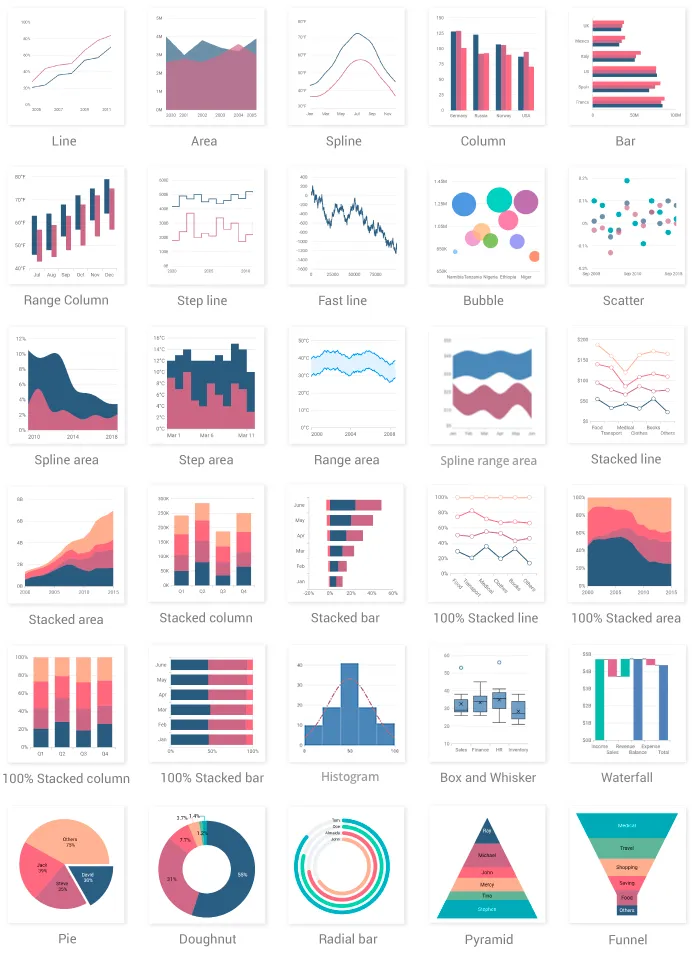
30+ Chart types
Ranging from simple day-to-day charts like line charts, bar charts, area charts to complex financial charts that are highly customizable.
Chart animation
Charts for ASP.NET Core provides fluid animation to represent data with smooth transitions.
Performance
Well thought out efforts, and focuses mainly on fast paced performance to render 100k data in less than a second.
SVG rendering
Vector based clean and crisp rendering for all your responsive and scaling needs.
Data Editing
Provides drag and drop support to the rendered points. Data editing allows you to manipulate the data on a chart.
Trendlines
Shows the price direction and movement speed. Trendlines can be generated for Cartesian type series (Line, Column, Scatter, Area, Candle, HiLo, etc.) except bar. More than one trendline can be added to a series.
Globalization and localization
Enables users from different locales to use them by formatting dates, currency, and numbering to suit preferences.
Exporting
Export charts to PDF documents or as image formats such as SVG, PNG and JPEG.
https://www.syncfusion.com/aspnet-core-ui-controls/charts
#asp.net core charts #chart types #charts #web-development #graphs