In this blog I have deployed two monitoring tools namely Prometheus and Grafana on top of Kubernetes. The main issue solved is that when the pod gets deleted the data is also lost to resolve this I used the PVC feature of kubernetes to make data persistent.

Let us know something about PV, PVCs, Prometheus, and Grafana:
**_PV: _**A Persistent Volume (PV) is a piece of storage in the cluster that has been provisioned by an administrator or dynamically provisioned using Storage Classes.
PVCs: A PersistentVolumeClaim (PVC) is a request for storage by a user. It is similar to a Pod. Pods consume node resources and PVCs consume PV resources. Pods can request specific levels of resources (CPU and Memory).
_Prometheus: _Prometheus is an open-source systems monitoring and alerting toolkit.Prometheus scrapes metrics from instrumented jobs, either directly or via an intermediary push gateway for short-lived jobs. It stores all scraped samples locally and runs rules over this data to either aggregate and record new time series from existing data or generate alerts.
_Grafana: _Grafana is open-source visualization and analytics software. It allows you to query, visualize, alert on, and explore your metrics no matter where they are stored. It provides you with tools to turn your time-series database (TSDB) data into beautiful graphs and visualizations.
Here’s how it is done…
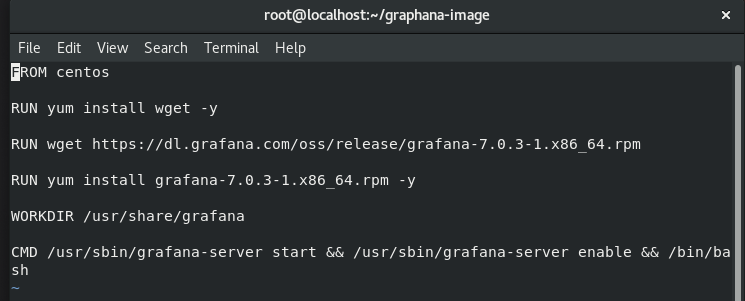
Images of Prometheus and Grafana are made using Dockerfile and uploaded on Docker Hub.

Dockerfile for Prometheus
#grafana #deployment #prometheus #pvc #kubernetes