Understanding how to evaluate clusters
**Clustering **is defined as finding natural groups in the data. But this definition is inherently subjective.
What are natural groups?
If we see the below picture, can we figure out the natural group of the flowers? Is it by the shape or is it by the color? It may even be by the size or species of the flower. Hence, t_he notion of a natural group changes based on what characteristics we are focussing on._
Fig 1: Flowers (Source: Unsplash)
Let’s take another example, where we have some points or observations in a 2D plane, i.e. we have two attributes only
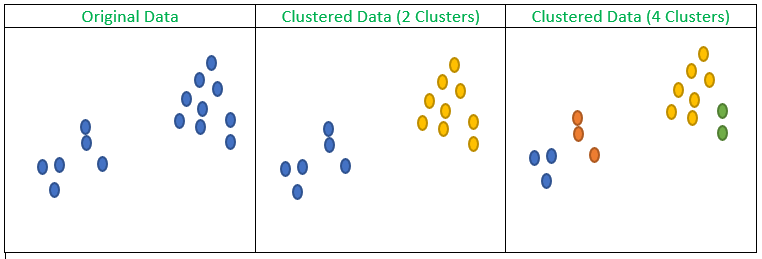
Fig 2: Original Data and clustering with different number of clusters
If we look at the above figure which has three subfigures. The first subfigure has the original data, the second and third subfigure shows clustering with the number of clusters as two and four respectively (Observations belonging to the same cluster are marked with the same color).
Fortunately, we can still visualize and try to gauge the quality of the clusters, however, if we go for more numbers features, we can’t visualize and see. Hence, there needs to be a mechanism, some measure which can make us compare two or more sets of clusters, or maybe two or more clustering algorithms on the same set of data. Unfortunately, like the way we can compare classification algorithms using accuracy or in case of regression using mean squared error, it’s not so clear cut for clustering.
Clustering Tendency:
What if the data do not have any clustering tendency, even if the data is random and we apply k-means, the algorithm will generate k-clusters. Hence, how do we measure, if the data has a clustering tendency or not? To measure the same we take the help of Hopkins Statistic.
Hopkins Statistic (H)
In this scheme, as many artificially generated random points are added as there are original data points in the dataset. For each of the original points, the distance with it’s nearest neighbor is calculated, denoted by **w **and the same exercise is repeated for the artificially generated points. Here, distance with the nearest neighbor is calculated as u.

A value near 0.5 indicates the data do not have clustering tendencies as both of w and p are equal.
Cluster Evaluation Measures:
Sum of Squared Error (SSE):-
The most used clustering evaluation tool is the sum of squared error which is given by the below equations.
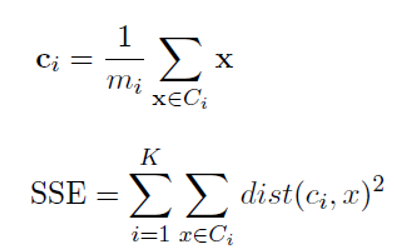
SSE Equations (Image Source: Authors)
Basically, at the first step, we find the centroid of each cluster by taking an average of all the observations in that cluster.
- Then we find how much the points in that clusters deviate from the center and sum it.
- Then we sum this deviation or error of individual clusters.
- SSE should be as low as possible.
I always understand the intuitions better with an example, let’s just do that
#clustering #data-science #cluster #data analysis