Understand Q-Q plots and implement it in Python
A Q-Q plot, or Quantile-Quantile plot, is a graphical method to verify the distribution of any random variable such as normal, exponential, lognormal, etc. It is a statistical approach to observe the nature of any distribution.
For example, if given a distribution need to be verified if it is a normal distribution or not, we run statistical analysis and compare the unknown distribution with a known normal distribution. Then by observing the results of the Q-Q plot, we can confirm if the given distribution is normally distributed or not.
Steps to plot a Q-Q plot:
- Given an unknown random variable.
- Find each integral percentile value or 100 z-values.
- Generate a known random distribution and follow steps 1–2 for this distribution too.
- Plotting Q-Q plot
Given a random distribution, that needs to be verified if it is a normal/gaussian distribution or not. For understanding, we will name this unknown distribution **X, **and known normal distribution as Y.
Generate unknown distribution X:
X = np.random.normal(loc=50, scale=25, size=1000)
we are generating a normal distribution having 1000 values with mean=50 and standard deviation=25.
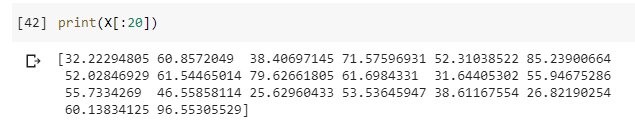
(Image by Author), first 20 random values of X
Find 100 percentile values:
X_100 = []
for i in range(1,101):
    X_100.append(np.percentile(X, i))
Compute each integral percentile (1%, 2%, 3%, . . . , 99%, 100%) value of X random distribution and store it in X_100.
#towards-data-science #artificial-intelligence #machine-learning #statistics #data-science #data analysisa