As we start with machine learning, for me, the first model to understand is the least squares. A simple model that is easy to perform and gives a lot of insights about your datasets.
This model assumes that the expected **_E(Y|X) _**values of the dependent variable are linear to the inputs X1,…, Xn.
Least Squares
It’s a supervised learning algorithm that takes an input vector, X^T = (X1, X2, …, Xp), and want to predict the output** Y**. The mathematical expression has the form
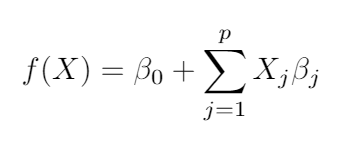
Linear regression model, self-generated.
The linear model assumes that the regression function E(Y|X) is linear or a reasonable approximation. The β are called parameters or coefficients and the variables X can be of different types:
- Quantitative variables, that can be transformed with logs, polynomial representations, etc…
- Numeric or “dummy” variables coding the distinct levels of a qualitative input.
- Interactions between other variables.
Now you should be thinking that the model is not linear after applying logs, polynomial, and interaction transformation, and it’s true, but we’re keeping the linearity in the β parameters.
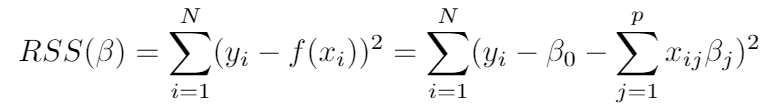
In the least-squares, we pick the β coefficients to minimize the error function of the sum of the residuals squared.
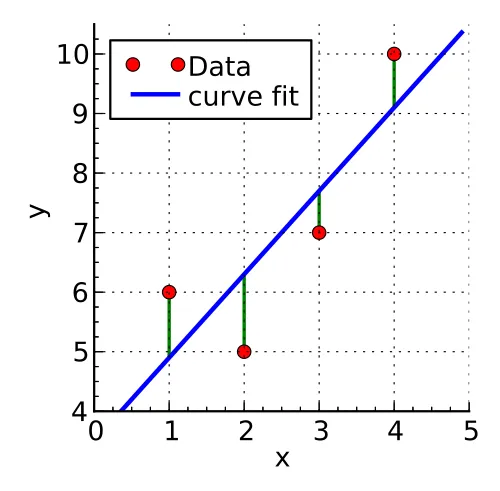
The next image represents a regression, where we try to predict y using the vector X of one variable.
In the image you have the prediction made by least squares in blue, the data values in red, and the distance between them or error in green, the error is calculated by adding all the error distances squared.
#deep-learning #linear-regression #machine-learning #mathematics #data-science