Code generation time is a significant contributor to total build time for optimized builds. During this step of the compilation process, source code is passed through several algorithms that transform your program into an optimized version that can be executed more efficiently. In general, the optimization of a C++ function happens quickly and poses no problem. In exceptional cases, however, some functions can become large and complex enough to put pressure on the optimizer and noticeably slow down your builds. In this article, we show how you can use C++ Build Insights to determine if slow code generation is a problem for you. We demonstrate two ways to diagnose these issues: first manually with the vcperf analysis tool, and then programmatically with the C++ Build Insights SDK. Throughout the tutorial, we show these techniques being used to improve the build time of Chakra, the open-source JavaScript engine, by 7%.
How to obtain and use vcperf
The examples in this article make use of vcperf, a tool that allows you to capture a trace of your build and to view it in the Windows Performance Analyzer (WPA). The latest version is available in Visual Studio 2019.
1. Follow these steps to obtain and configure _vcperf _and WPA:
- Download and install the latest Visual Studio 2019.
- Obtain WPA by downloading and installing the latest Windows ADK.
- Copy the
perf_msvcbuildinsights.dllfile from your Visual Studio 2019’s MSVC installation directory to your newly installed WPA directory. This file is the C++ Build Insights WPA add-in, which must be available to WPA for correctly displaying the C++ Build Insights events. - MSVC’s installation directory is typically:
C:\Program Files (x86)\Microsoft Visual Studio\2019\{Edition}\VC\Tools\MSVC\{Version}\bin\Hostx64\x64. - WPA’s installation directory is typically:
C:\Program Files (x86)\Windows Kits\10\Windows Performance Toolkit. - Open the
perfcore.inifile in your WPA installation directory, and add an entry for theperf_msvcbuildinsights.dllfile. This tells WPA to load the C++ Build Insights plugin on startup.
You can also obtain the latest vcperf and WPA add-in by cloning and building the vcperf GitHub repository. Feel free to use your built copy in conjunction with Visual Studio 2019!
2. Follow these steps to collect a trace of your build:
- Open an elevated x64 Native Tools Command Prompt for VS 2019.
- Obtain a trace of your build:
- Run the following command:
vcperf /start MySessionName. - Build your C++ project from anywhere, even from within Visual Studio (vcperf collects events system-wide).
- Run the following command:
vcperf /stop MySessionName outputFile.etl. This command will stop the trace, analyze all events, and save everything in the outputFile.etl trace file. - Open the trace you just collected in WPA.
Using the Functions view in WPA
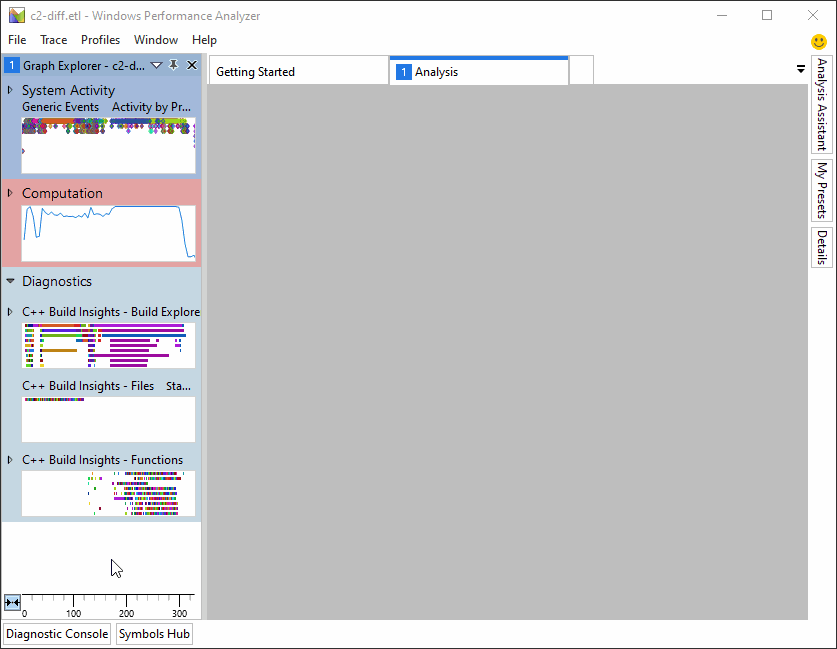
C++ Build Insights has a dedicated view to help diagnose slow code generation time: the Functions view. After opening your trace in WPA, you can access the view by dragging it from the Graph Explorer pane to the Analysis window, as shown below.
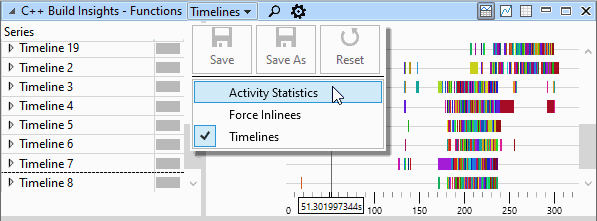
The Functions view offers 3 presets that you can select from when navigating your build trace:
- Timelines
- Activity Statistics
- Force Inlinees
Click on the drop-down menu at the top of the view to select the one you need. This step is illustrated below.
In the next 3 sections, we cover each of these presets in turn.
#c++ #diagnostics #programming-c #cplusplus