This article is an attempt to solve a real-world investment management problem by using a data science approach by analysing the impact of the Covid-19 pandemic on NIFTY-50 stocks.
Pandemic events such as Covid-19 are “black swan” events as they cannot be predicted, and no diversification strategy can protect an investment from these kinds of systemic risks. As the pundits say, “diversification will fail you when you need the most”. In events such as the financial crisis in 2008 or the Covid-19 pandemic which we are facing now, even a well-diversified portfolio will lose money. So how do you protect your wealth when the market crashes during such events but also participate in the upside and get the best of both worlds without losing out on your financial goals. The answer is to have an “insurance” or “safe net” sort of strategy when building your portfolio. Once such “safe net” strategy is the Constant Proportion Portfolio Insurance (CPPI).
Even though these kind of strategies are being used in the industry in many forms and techniques, here we attempt to look through a step-by-step, Data science methodology of Extracting adequate data from relevant sources, Cleaning, Transforming and Modelling them, implementing an on-the-fly CPPI algorithm, arriving at the back test results and interactively analyse the strategy using advanced data visualization methods. In the next few sections, we discuss more on the balance between user interactivity, intuitiveness and algorithmic complexity of the CPPI calculation rather than the nitty gritty of the CPPI as a Portfolio strategy. For more details on how CPPI works and a layman example of what it is, have a look at https://www.investopedia.com/terms/c/cppi.asp. We use Python/Anaconda for Data Engineering & Algorithms, Tableau for Data visualization and the analytics extension library- TabPy — as the technological tools for the solution.
Identify Data Sources and Data Preparation steps
Primary data source for our study is the NSE India website and we attempted to use web crawling to extract historical prices of the NIFTY-50 stocks. Then we found a very useful Library/API ‘NSEPY’ which does it in a more graceful manner of extracting historical prices given a stock symbol. So, we first created a list of the 50 stocks and called the NSEpy library/api (https://github.com/swapniljariwala/nsepy/tree/master/nsepy) to extract data from Jan-2018 till Jun-2020.

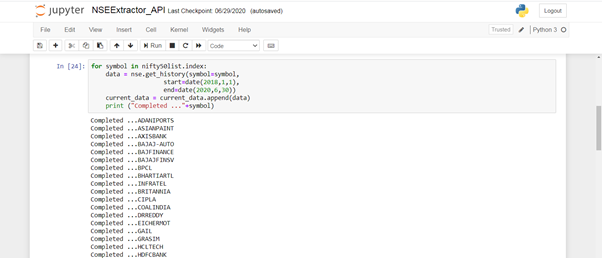
Raw data extracted from NSE will look like the following:

These data points are basically various price points on a given day for an equity. Handling daily frequency data for a portfolio analysis may be an overkill and for the sake of simplicity we will aggregate the data at a weekly level. From the daily prices, we will find the weekly price points like open, close, high and low. We should also be careful about the column headings and make sure they look clean without any spaces or special characters in between. Once you convert to weekly time series data, the data frame should like like below:

After this weekly grouping, calculate the weekly returns which is the percentage change of price from the previous week.
#nifty 50 #cppi strategy #testing #programming