I was exploring the Azure ML Studio Classic and thought of working on a data set. In this I will explain the method I used for this Employee Promotion Data set.
This data set is available here:https://datahack.analyticsvidhya.com/contest/wns-analytics-hackathon-2018-1/
Data Visualization
We can visualize the data set once it is dragged into the designer.
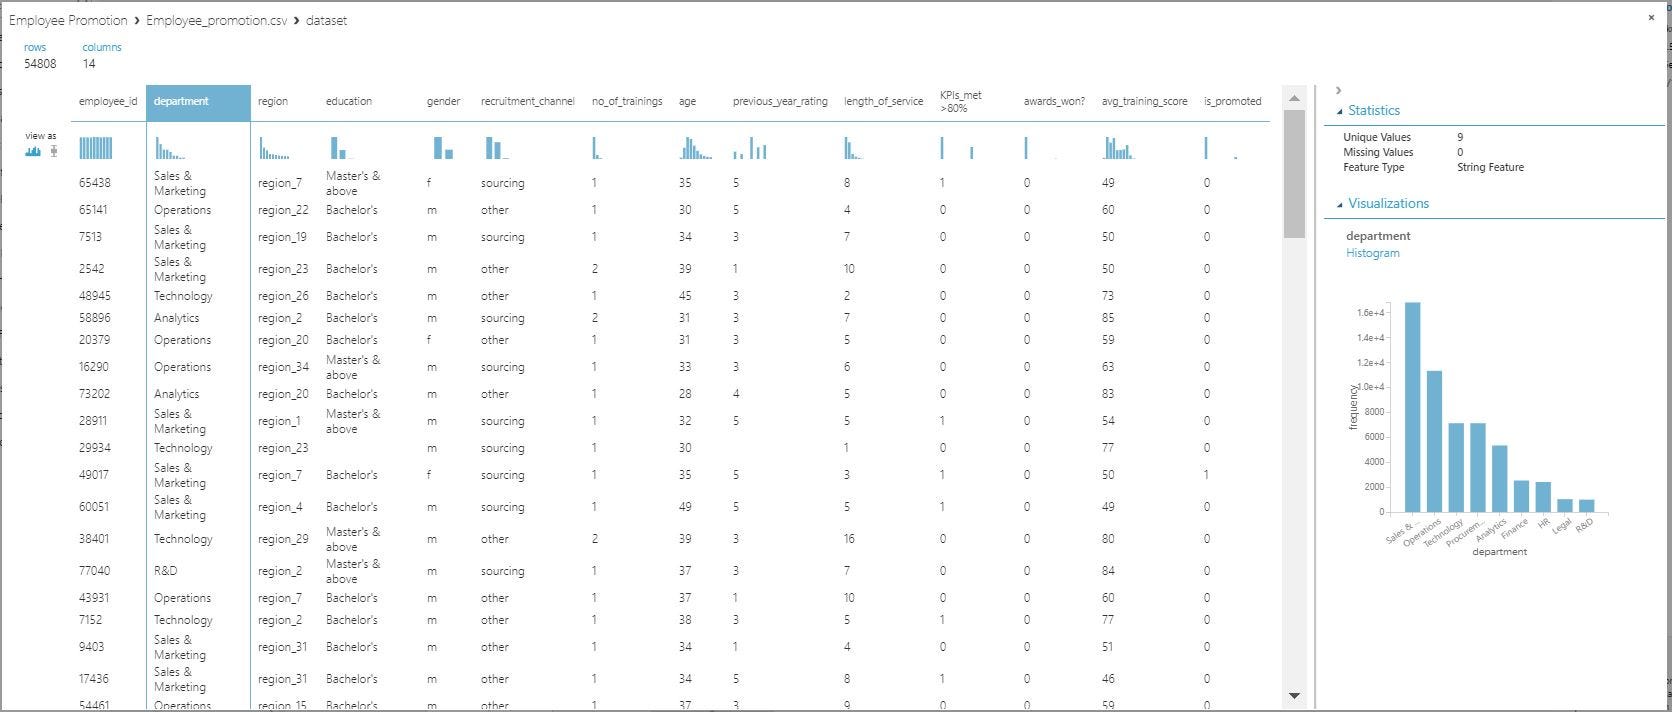
Visualizing Employee Promotion Data Set
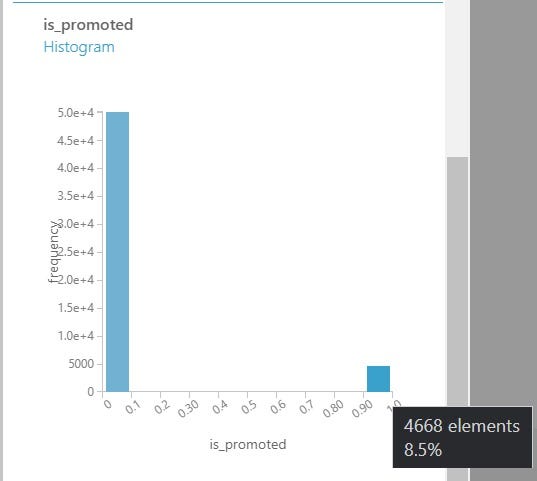
When we look at the distribution of the output variable i.e. is_promoted we see that we have only 8.5% of employees who get promoted. This is a imbalanced classification problem where we have one class in majority and the other in minority.

Imbalanced Class for Promoted Employees
By looking at the data we get to know that there are 7 categorical features : Department, Region, Education, Gender, Recruitment_channel, KPIs_met >80% , awards_won? and we have 5 numerical features : no_of_trainings, age, previous_year_rating ,length_of_service, avg_training_score.
Now we remove the employee_id column from the data set as each employee has a unique id and it is not useful for our prediction purpose.After that we split the data into train and test parts using the Split Data module.
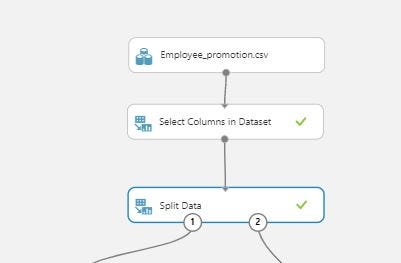
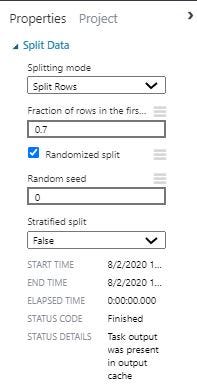
Splitting data into train and test part
We split the data into 70% for training and 30% for testing and for being able to replicate our prediction a random seed of 0 has been used.
Data Cleaning and Feature Engineering
The numerical data column previous year rating has missing values so it was cleaned using MICE algorithm.
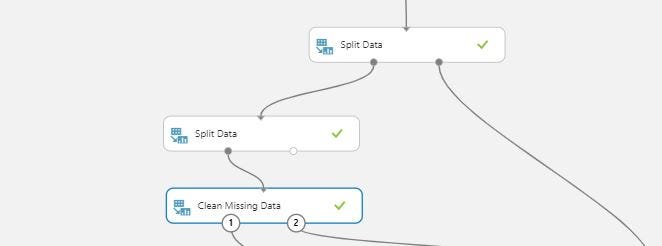
Cleaning Numerical Feature using MICE.
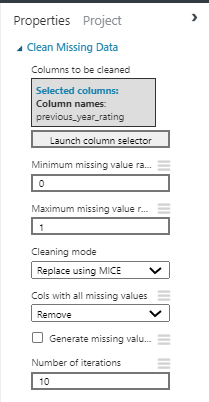
Properties used for Cleaning
We can select the columns which we want to clean using the selected columns. The minimum missing value ratio implies the minimum number of rows needed with the missing value in the feature column to start the cleaning process. Similarly the maximum missing value ratio implies the maximum number of rows to be missing to start the cleaning process.Only the feature columns which have missing value row count between these two will be cleaned. We have different methods to clean the missing data which is shown below.
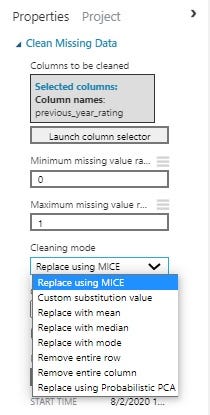
Different Cleaning Methods
Now I created two new columns by binning the age and length of service features. Tried different edges for both but the ones below gave better results.
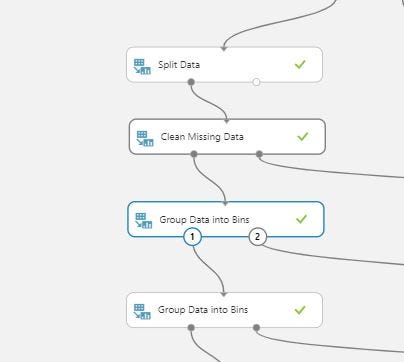
Grouping data to get new features
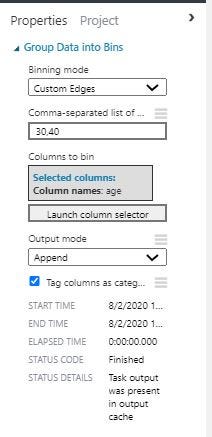
Edges for age column binning
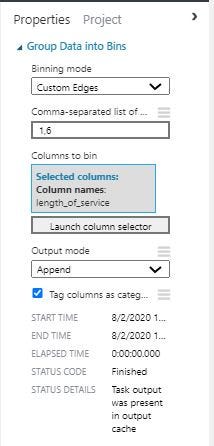
Edges for length_of_service column binning
The age column was binned into 3 groups one from less than 30 age, the next from 31 to 40 and the last one is greater then 40. Similarly for the length_of_service column we have less than 1 year ,2 to 6 years and greater than 6 years.
Now I cleaned the categorical column education using MICE and marked the new binned columns of age and length_of_service as categorical data using edit metadata module.
#classification #machine-learning #azure-ml-studio #imbalanced-data