In the previous stories, I had given an explanation of the program for implementation of various Regression models. As we move on to Classification, isn’t it surprising as to why the title of this algorithm still has the name, Regression. Let us understand the mechanism of the Logistic Regression and learn to build a classification model with an example.
Overview of Logistic Regression
Logistic Regression is a classification model that is used when the dependent variable (output) is in the binary format such as 0 (False) or 1 (True). Examples include such as predicting if there is a tumor (1) or not (0) and if an email is a spam (1) or not (0).
The logistic function, also called as sigmoid function was initially used by statisticians to describe properties of population growth in ecology. The sigmoid function is a mathematical function used to map the predicted values to probabilities. Logistic Regression has an S-shaped curve and can take values between 0 and 1 but never exactly at those limits. It has the formula of 1 / (1 + e^-value).

Sigmoid Function (Source)
Logistic Regression is an extension of the Linear Regression model. Let us understand this with a simple example. If we want to classify if an email is a spam or not, if we apply a Linear Regression model, we would get only continuous values between 0 and 1 such as 0.4, 0.7 etc. On the other hand, the Logistic Regression extends this linear regression model by setting a threshold at 0.5, hence the data point will be classified as spam if the output value is greater than 0.5 and not spam if the output value is lesser than 0.5.
In this way, we can use Logistic Regression to classification problems and get accurate predictions.
Problem Analysis
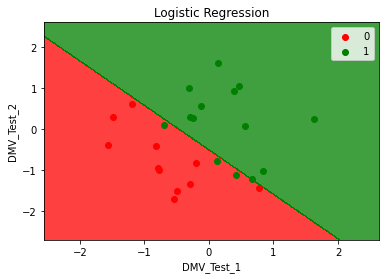
To apply the Logistic Regression model in practical usage, let us consider a DMV Test dataset which consists of three columns. The first two columns consist of the two DMV written tests (**_DMV_Test_1 _**and DMV_Test_2) which are the independent variables and the last column consists of the dependent variable, **_Results _**which denote that the driver has got the license (1) or not (0).
In this, we have to build a Logistic Regression model using this data to predict if a driver who has taken the two DMV written tests will get the license or not using those marks obtained in their written tests and classify the results.
Step 1: Importing the Libraries
As always, the first step will always include importing the libraries which are the NumPy, Pandas and the Matplotlib.
import numpy as np
import matplotlib.pyplot as plt
import pandas as pd
Step 2: Importing the dataset
In this step, we shall get the dataset from my GitHub repository as “DMVWrittenTests.csv”. The variable _X _will store the two “_DMV Tests _”and the variable _Y _will store the final output as “Results”**_. _**The dataset.head(5)is used to visualize the first 5 rows of the data.
#towards-data-science #classification #mls #machine-learning #artificial-intelligence #deep learning