WHAT’S REALLY GOING ON UNDER THE HOOD WHEN YOU’RE ANALYZING DATA IN PYTHON?
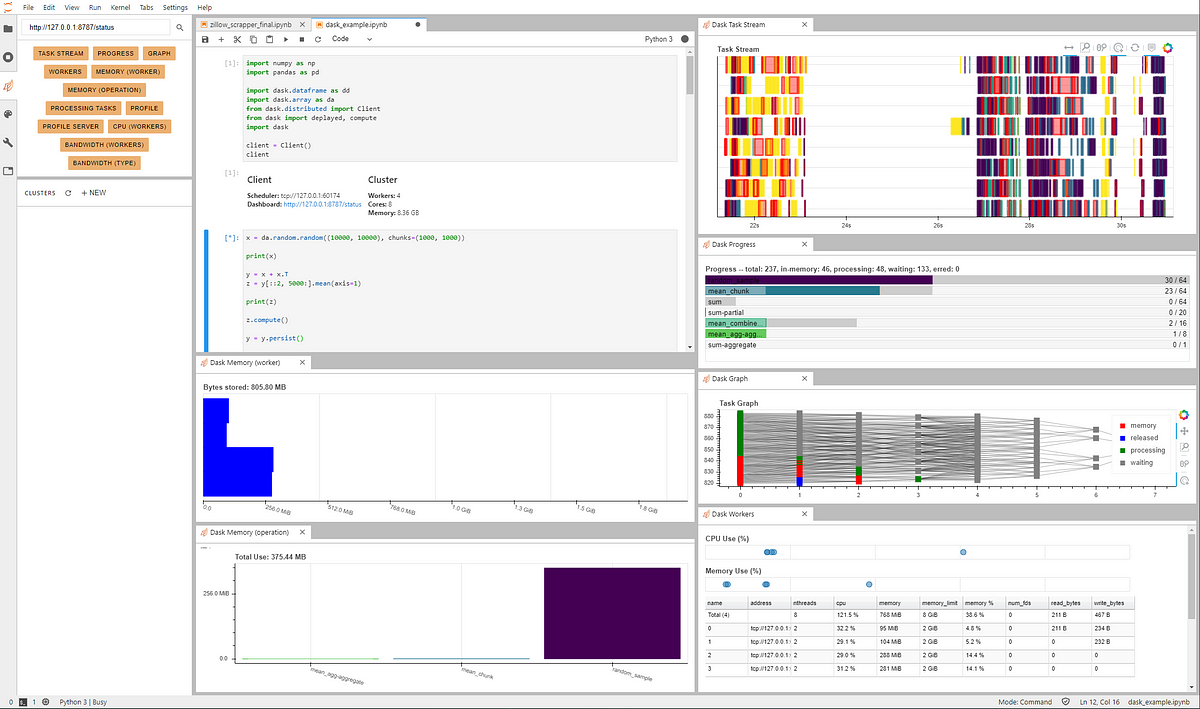
Dask is an awesome tool to help you both visualize what’s happening computationally when you run your code, as well utilize parallel processing when executing Pandas or Numpy operations.

THERE’S A GOOD AMOUNT OF INFORMATION ON DASK ALREADY OUT THERE
Several articles say it better than I could, and I’d rather not conduct some sort of redundant behavior for the sake of having more content in an article. Here’s some places to get you started:
THE BASICS IN EASY TO UNDERSTAND TERMS
- Decreases processing time when running operations on Large datasets — like pandas dataframes or numpy arrays
- Stores and processes objects that are unable to fit into memory
- Allows parallel processing locally or via cluster
- Offers graphs around operation processing
JupyterLab
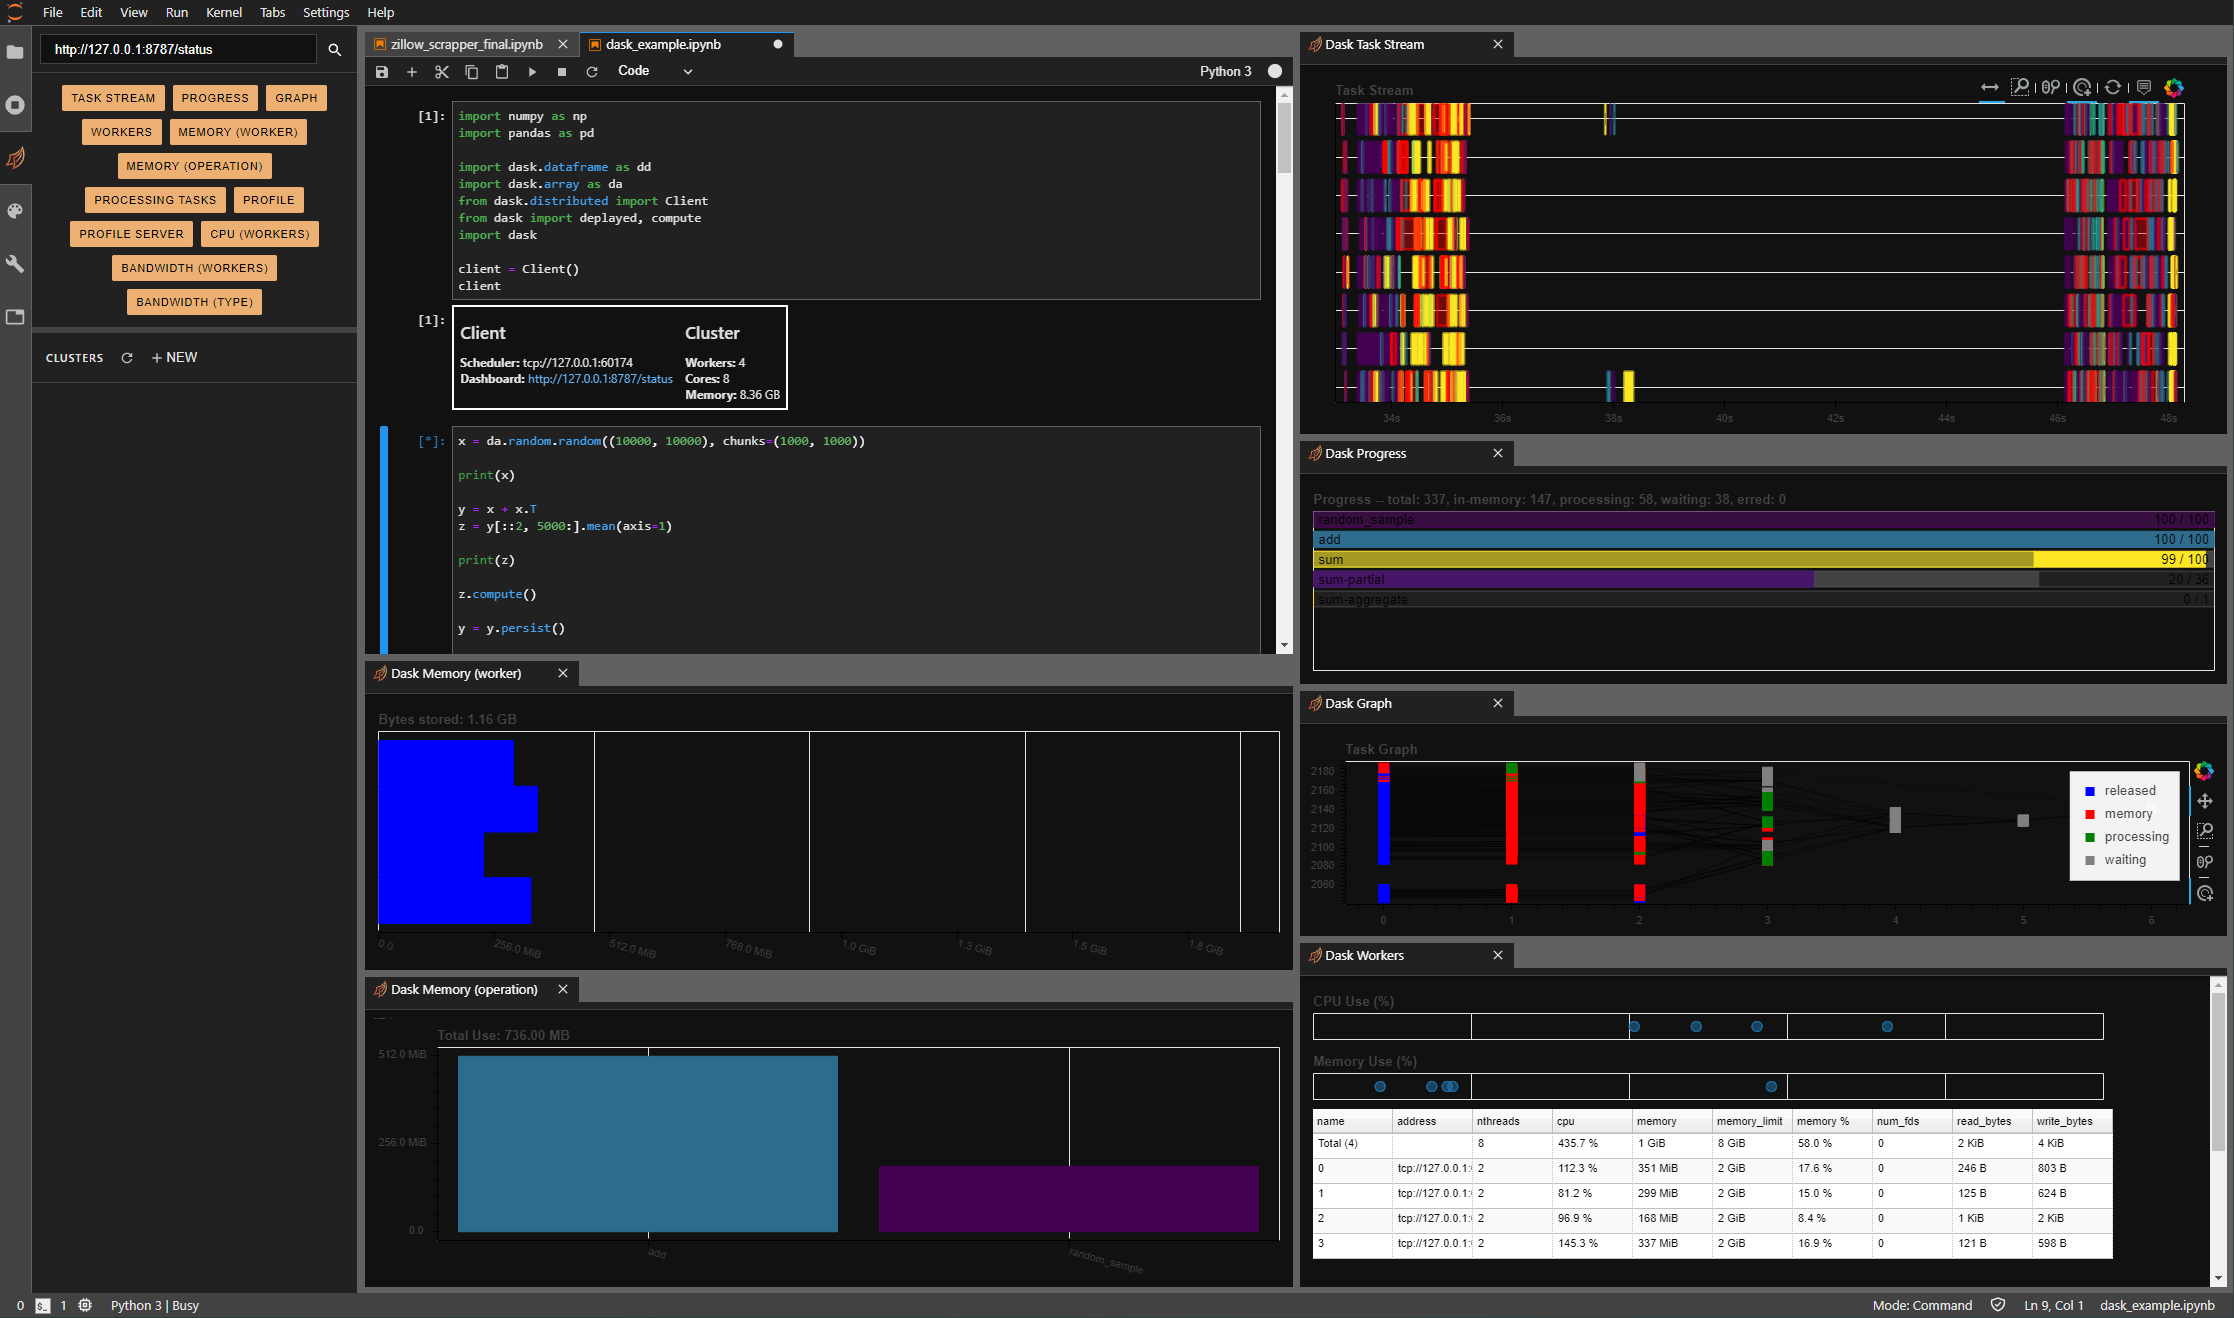
Dask offers an extension for jupyterlab which you can install through pip/conda. I’m assuming you know how to open JupyterLab. If not, install it and run jupyter lab in anaconda prompt. Change to light or dark them with the tools drop down. Install the below requirements:
INSTALLATION
To install the Dask JupyterLab extension, you will need both JupyterLab, and Node.js. These are available through a variety of sources. One source common to Python users is the conda package manager.
#data-science #python #data-visualization #jupyterlab #dask #data analysis