Welcome to the Financial Blog post series, Part I! Here at Progress, we love attractive and alluring components. My team specifically loves attractive Angular components. Recently we built a demo Angular app that shows off a number of our gorgeous components working together to create this Financial Portfolio Demo App:
In this series I am going to walk through the Angular components that make up this app and delve into theKendo UI components that each one uses! We will go through the Angular Stock Chart Component, along with other chart components, inputs, buttons, and of course, our infamous Grid Component to build out a Financial Portfolio application, capable of keeping you up-to-date with the stocks of your choice!
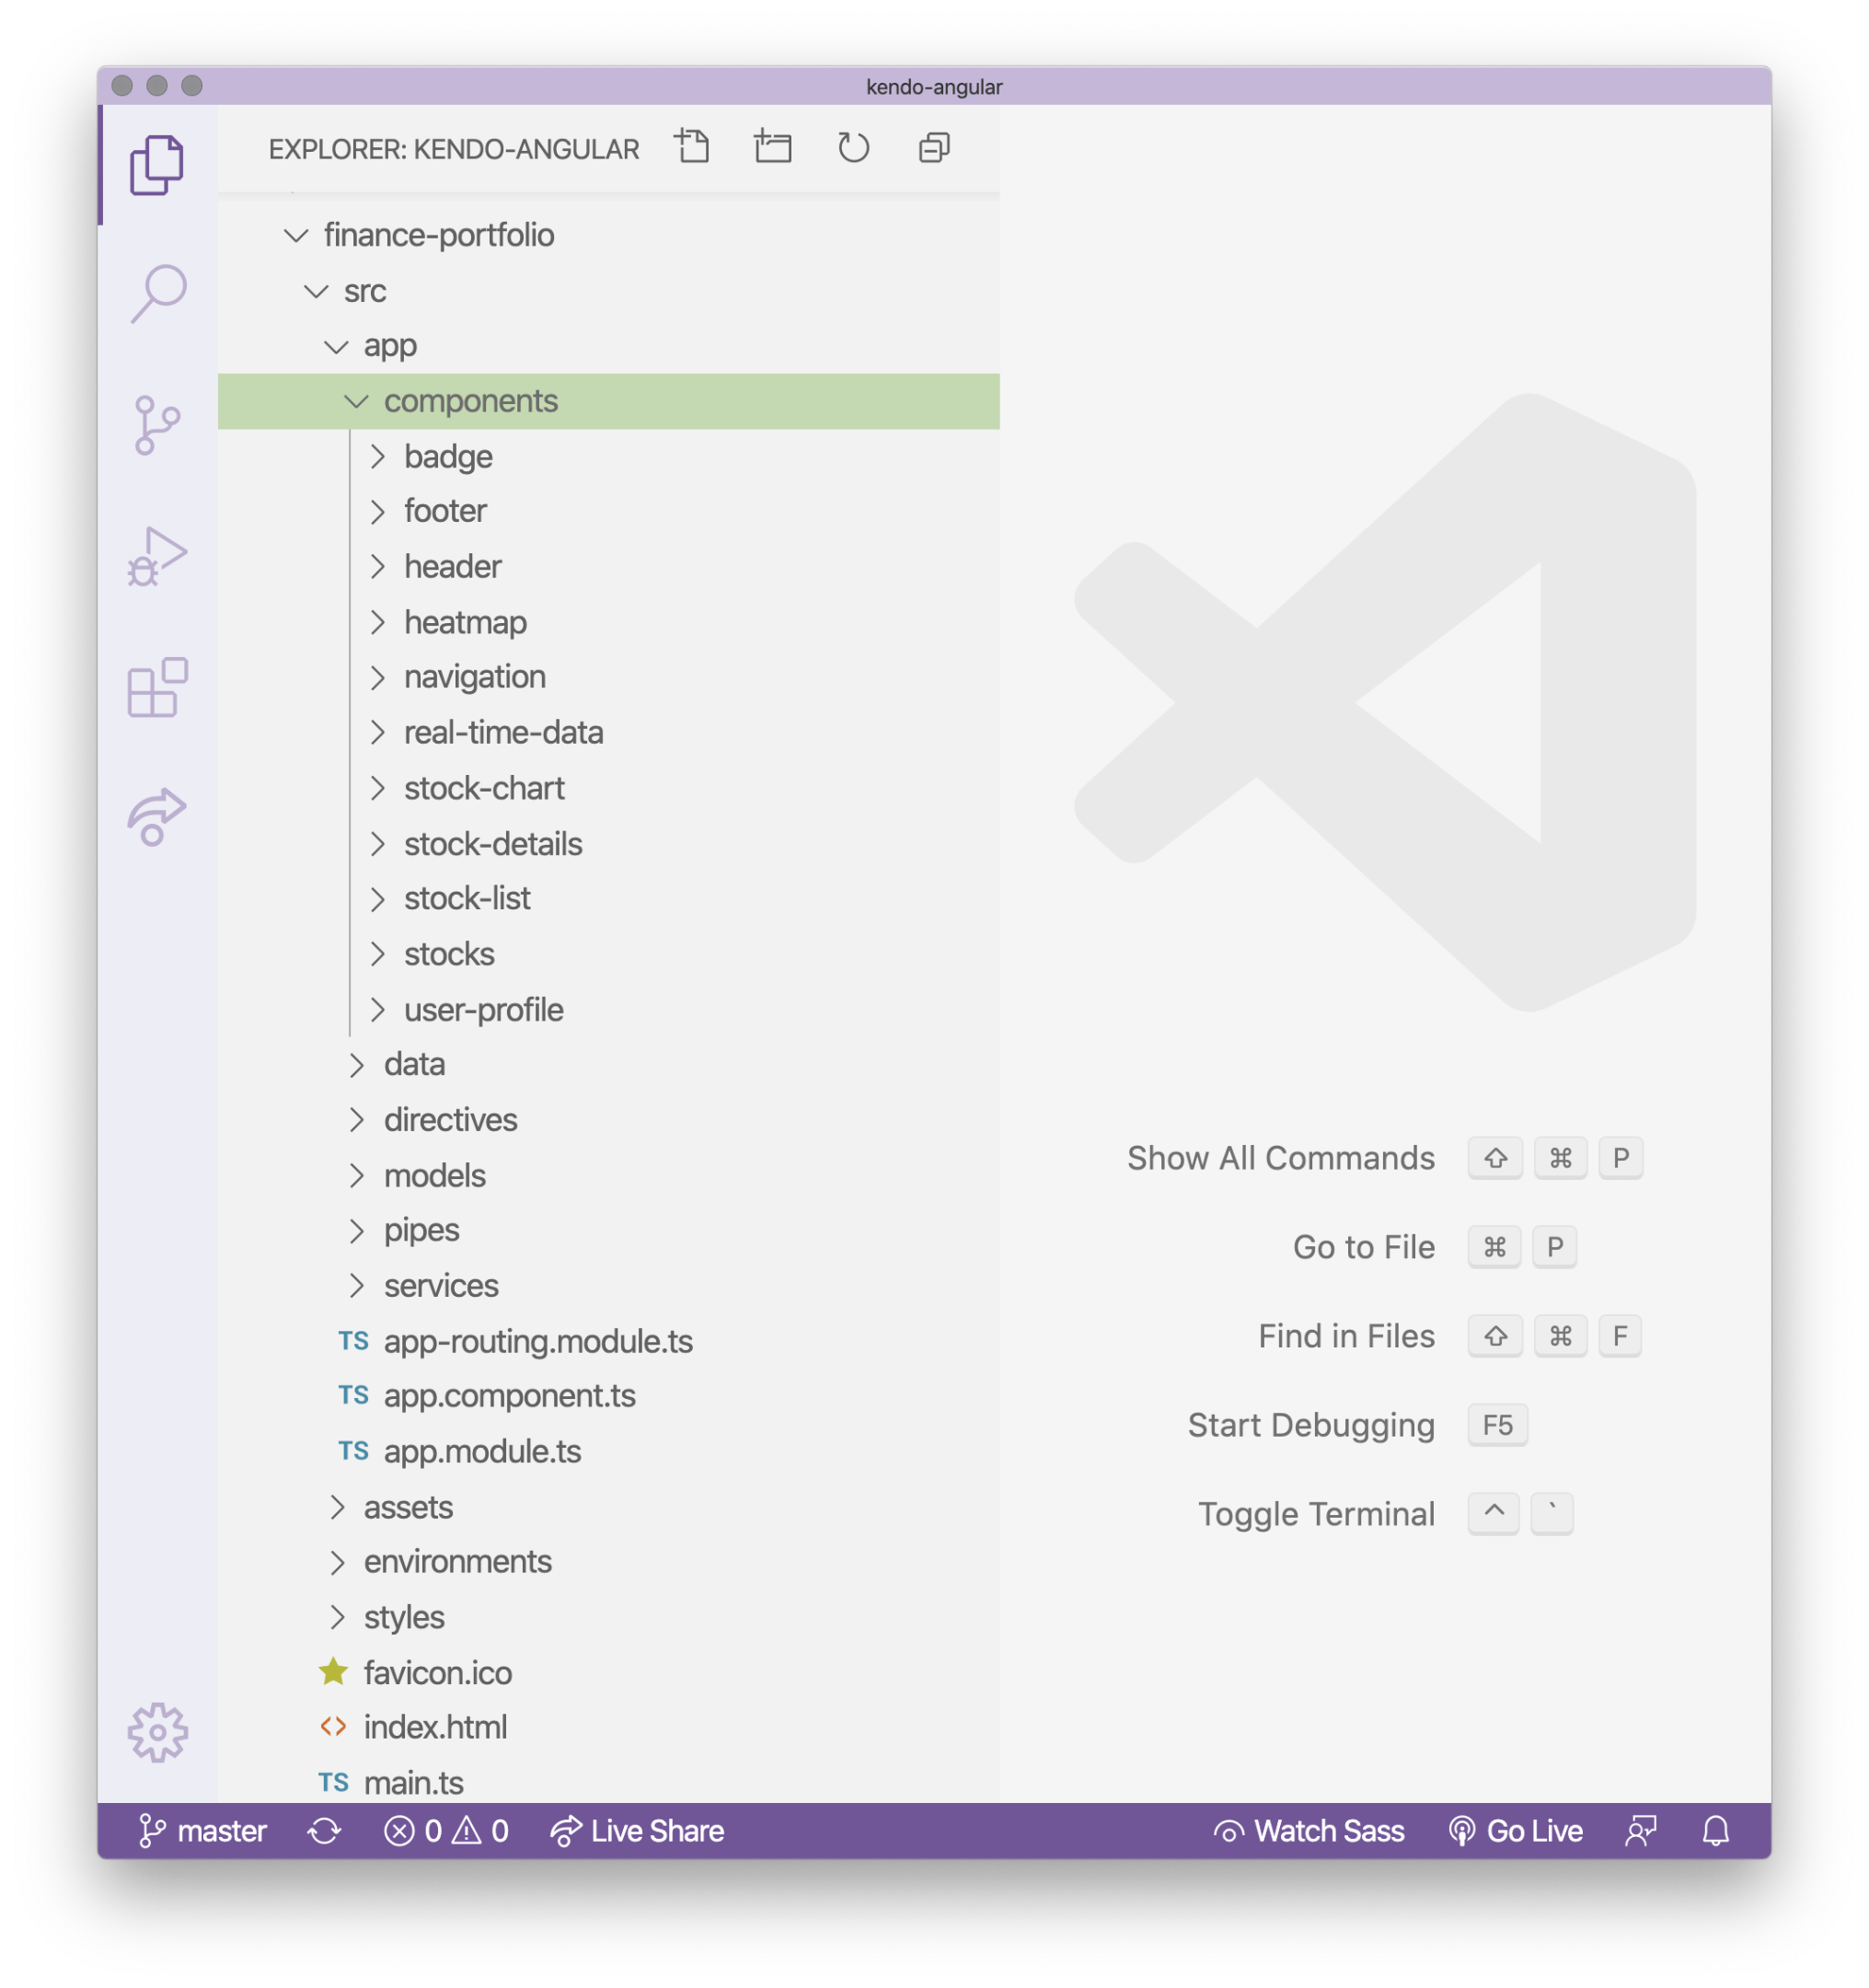
I’ve broken the application into five major Angular Components:
- Stock Chart
- Stock List
- User Profile
- Real Time Data
- Heatmap
To make the reading experience more bite-sized, in this first post, I will cover the Stock Chart and Stock List components (and the child components they employ)—check out part II for the rest to be covered!
 Following Along
You can pull down the code and follow along—everything is available on GitHub and GitHub Pages!
- Clone the repo https://github.com/telerik/kendo-angular/tree/master/examples-standalone/finance-portfolio
- Go into the root of the application
cd kendo-angular/examples-standalone/finance-portfolio/ - Run
npm installandnpm start - Go to
http://localhost:4200in your web browser
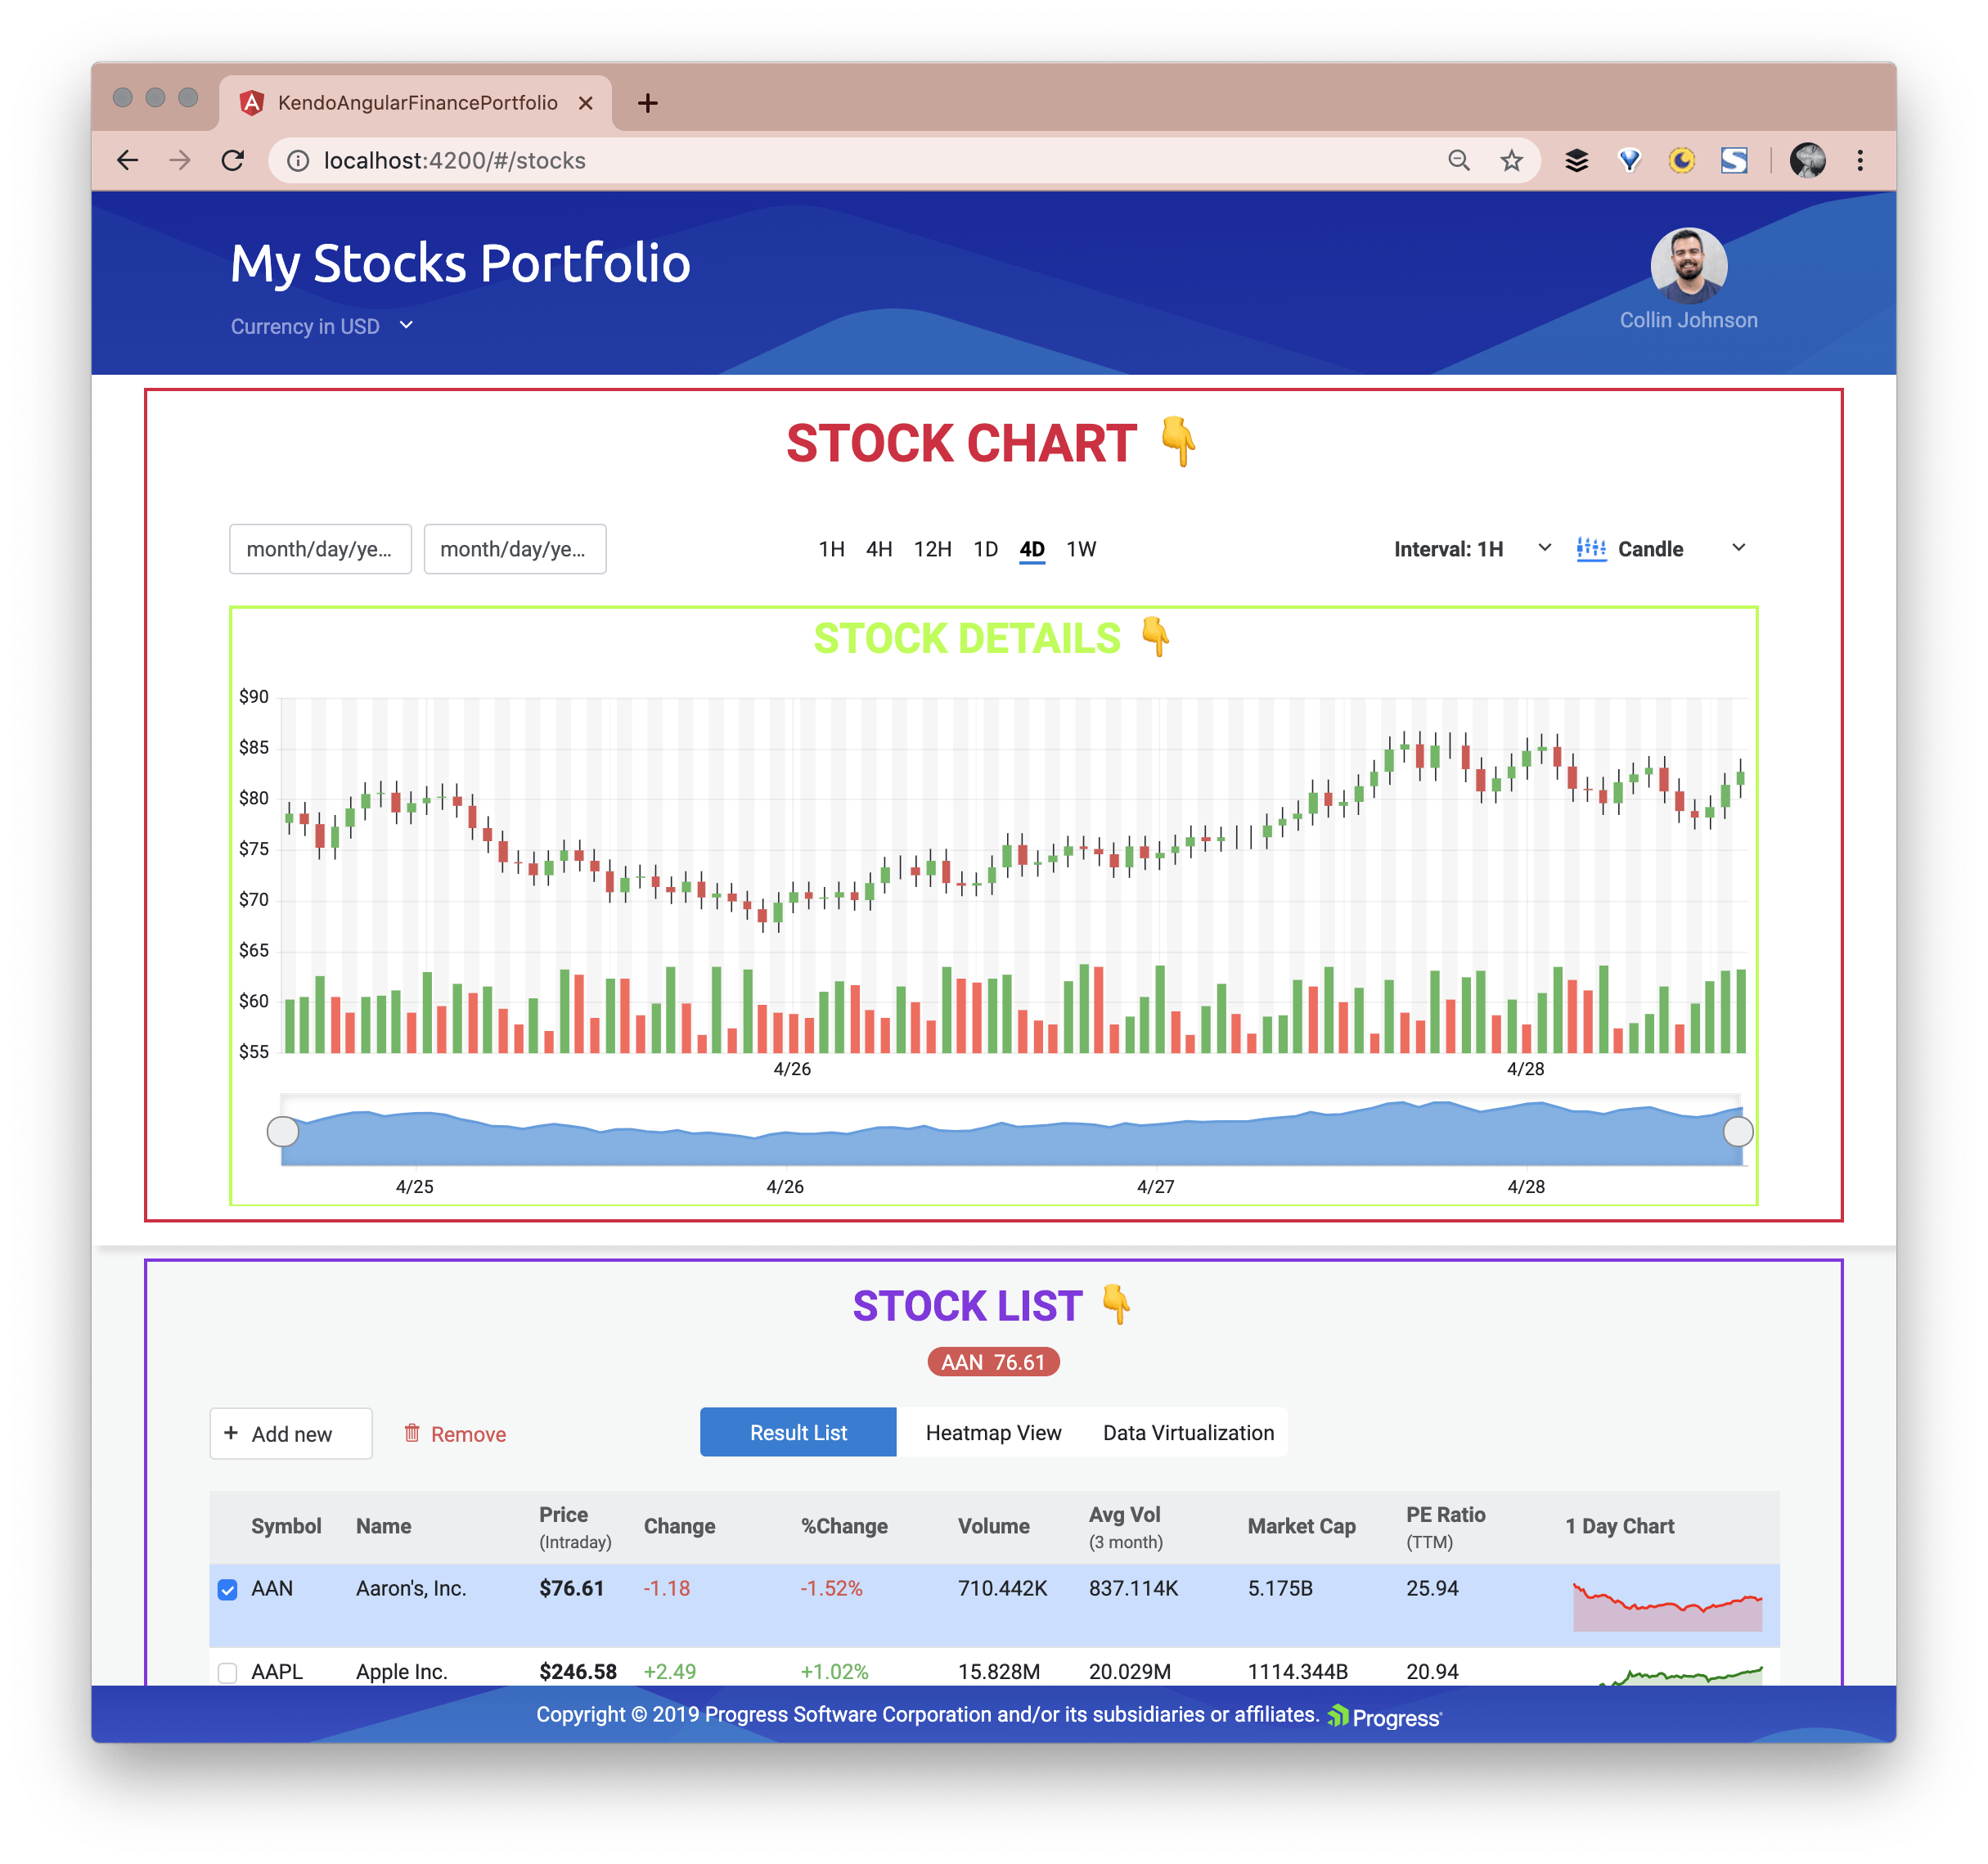
As you can see in the opening GIF, the app shows you the stock information you are interested in with our Kendo UI Stock Chart component. This component comes ready out-of-the-box with features to choose date ranges and time ranges for the stocks you want to look at. You can also toggle the type of chart you are viewing—Candle, Line, or Area.
Our Financial Portfolio application also shows the stocks in a Stock List, a Heatmap, and Stocks moving in real time as well as a user profile page. This demo is fully loaded with so many features! Let’s dive into this incredible demo by component (Angular component, that is).
Stock Chart & Stock Details Angular Components
Stock Chart with Stock Details and the Stock List are all visible by default on the dashboard (landing page). I’ve given them titles and outlines here, so you can see where those Angular components visually are: