It makes me really excited when I can apply machine learning techniques on day to day marketing problems. To give you some background, I am working in a big advertising agency and some of my clients are top advertisers in the U.S. whose products and services cover the whole country and they have a lot of marketing budget to spend (talking about 9 digits a year!). So our job is to help them spend the money smartly and efficiently!
One of the challenges is to develop strategy for all the local markets aka DMAs (DMA stands for “designated market area,” and may also be known as a media market). There are 210 DMAs in the U.S. and surely you can divide them by region or simply go by West, East, and Central. However, considering the demographic and economical differences within the large region, we may want to use some more data driven way to look at all these DMAs. So today I am going to use Clustering to get several clusters of markets that have most similarity within each cluster.
Before diving into the details, I want to show you my favorite chart when exploring machine learning.
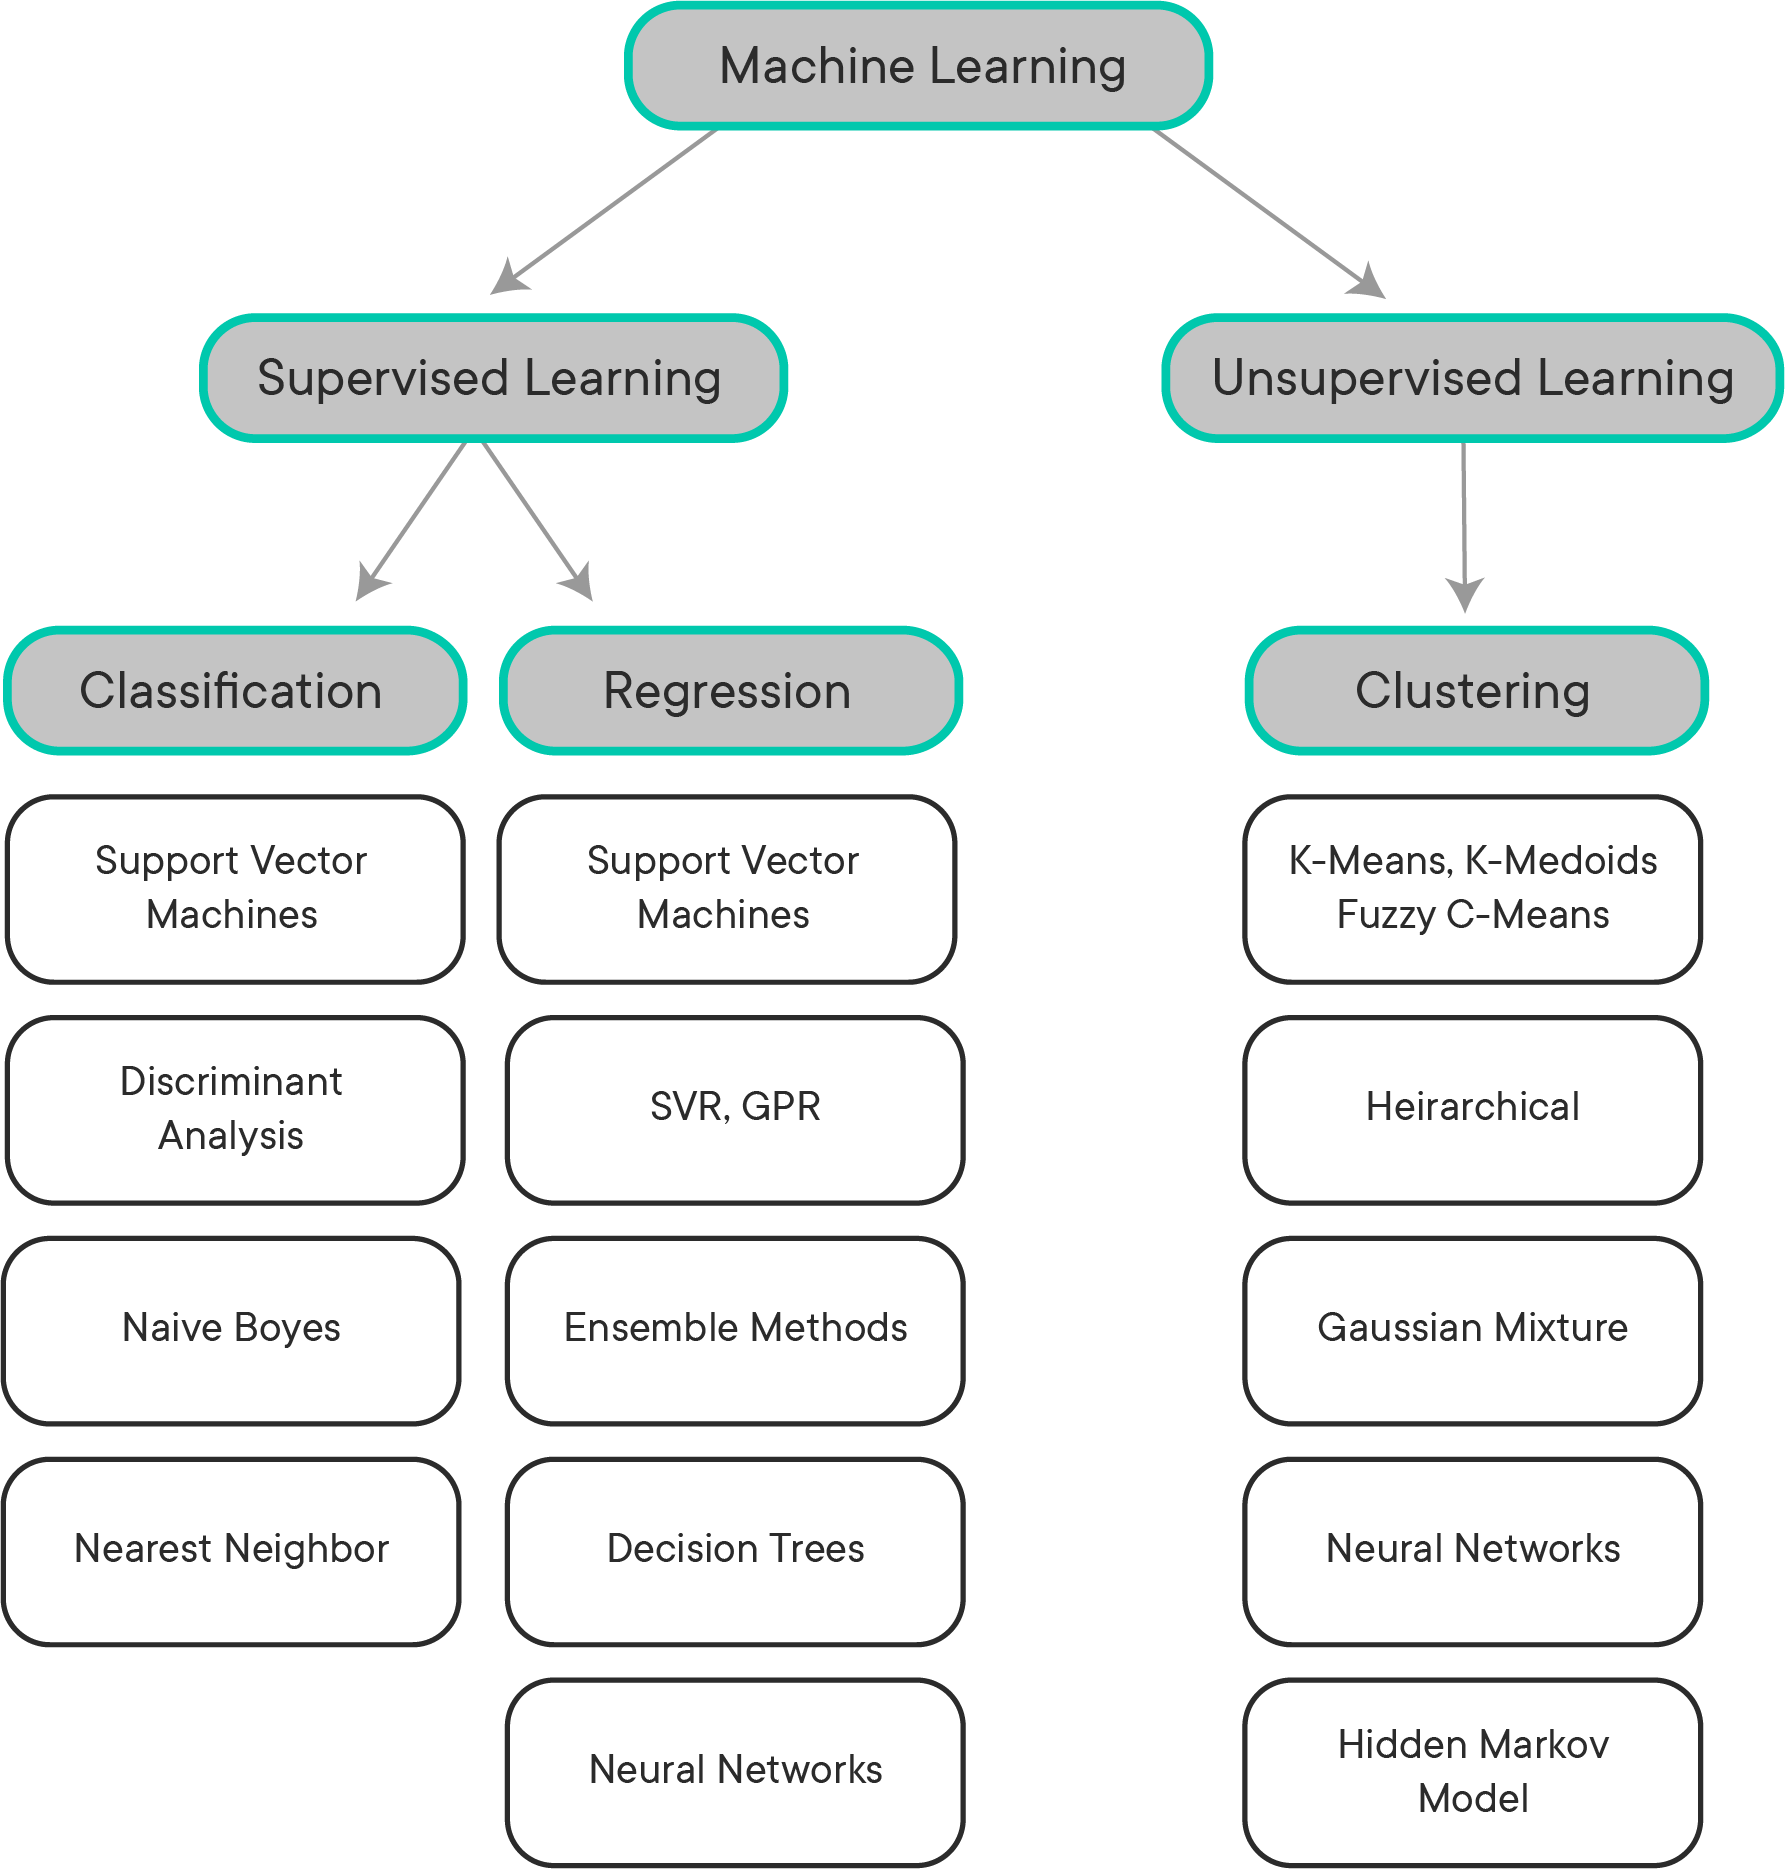
Clustering is under the branch of **Unsupervised Learning **which looks for previously undetected patterns in a data set with no pre-existing labels. The main idea behind clustering is that you want to group objects into similar classes in a way that the similarity among members of the same group is high and the similarity of different groups is low.
The most popular and widely-used algorithm is **K-Means Clustering Algorithm. **The k-means clustering algorithm is an iterative algorithm that reaches for a pre-determined number of clusters within an unlabeled dataset, and basically works as follows:
- Select 𝑘 initial seeds
- Assign each observation to the cluster with the nearest mean (least squared Euclidean distance)
- Recompute the cluster centroids for observations assigned to each cluster
- Keep iterating until there is no change to the centroids
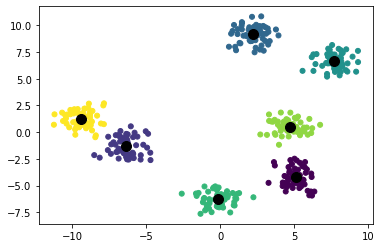
k means clustering example (k = 7)
Two assumptions are of main importance for the k-means clustering algorithm:
- To compute the “cluster center”, you calculate the (arithmetic) mean of all the points belonging to the cluster. Each cluster center is recalculated in the beginning of each new iteration
- After the cluster center has been recalculated, if a given point is now closer to a different cluster center than the center of its current cluster, then that point is reassigned to the closest center
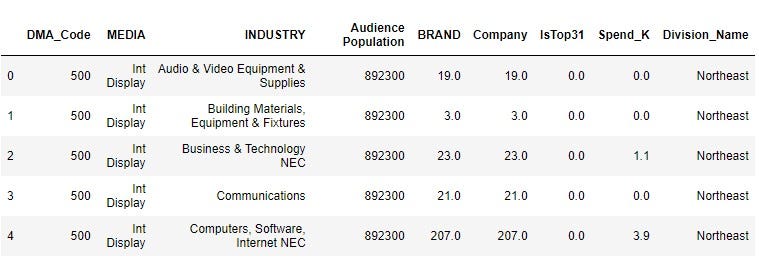
I will demonstrate how it works in Python with a marketing spend dataset I gathered from a research company Kantar for top 30 tech companies in the past 2 years.
market.head(5)
sp
Data Dictionary
- MARKET: Designated Market Area (DMA) is a region where the population can receive the same television and radio station offerings, and may also include other types of media including newspapers and Internet content
- MEDIA: 10 Common Media Types including TV, Radio, Outdoor, Digital, etc.
- Audience Population: Population of TV/Radio Audience with age 12+
- Company/BRAND: Number of Companies/brands that advertise in this market
- IsTop31: A subjective category made from Telecom industry on Market Importance. 0 means is not Top 31 market, 1 means Top 31 market
- Spend_K: Media Spend in Thousands Dollars(000)
Pre-processing categorical values
#Change MARKETS to categorical
market['DMA_Code']=market['DMA_Code'].astype('category')

#One Hot Encoding for Media and Industry
from sklearn.preprocessing import LabelBinarizer
def labelcoder(data, column):
    onehot = data.copy()
    lb=LabelBinarizer()
    lb_results = lb.fit_transform(onehot[column])
    lb_results_df = pd.DataFrame(lb_results, columns=lb.classes_)
    return lb_results_df
media_features = labelcoder(market, 'MEDIA')
industry_features = labelcoder(market, 'INDUSTRY')
division_features = labelcoder(market, 'Division_Name')
#Put them all together
market_df = pd.concat([market['DMA_Code'],scaled_features, media_features, industry_features, division_features], axis=1)
Standardize Numerical Features
num_features = market[['Audience Population','BRAND','Company','IsTop31','Spend_K']]

from sklearn.preprocessing import MinMaxScaler
#Scale the numerical features
scaler = MinMaxScaler()
scaled = scaler.fit_transform(num_features)
scaled_features = pd.DataFrame(scaled, columns = num_features.columns)
Set up K-Means
Find the optimal K using Elbow Method
This step is very important because we don’t just want an arbitrary number of clusters but want to find the number of K that separate data points as much as possible while not introducing overall complexity. The common metric to use is Inertia — sum of squared distances of samples to their closest cluster center
import matplotlib.pyplot as plt
from sklearn.cluster import KMeans

sum_of_squared_distances = []
K = range(1,20)
for k in K:
    km = KMeans(n_clusters=k)
    km = km.fit(market_df)
    sum_of_squared_distances.append(km.inertia_)

plt.plot(K, sum_of_squared_distances, 'bx-')
plt.xlabel('k')
plt.ylabel('Sum of Squared Distances to the Nearest Cluster')
plt.title('Elbow Method For Optimal k')
plt.show()
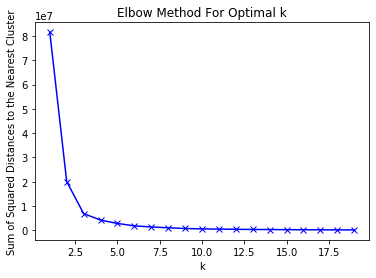
As the chart above shows, the diminishing return hits at k = 3. After k =3, the metric gets better at a much slower rate.
#towards-data-science #marketing #k-means #data-science #cluster-analysis #data analysis