This notebook demonstrates how you can perform Kernel Regression manually in python. While Statsmodels provides a library for Kernel Regression, doing Kernel regression by hand can help us better understand how we get to the find result.
First, I will show how Kernel Regression is done using Statsmodels. Next I will show how it is done by hand, then finally overlay both plots to show that the results are the same.
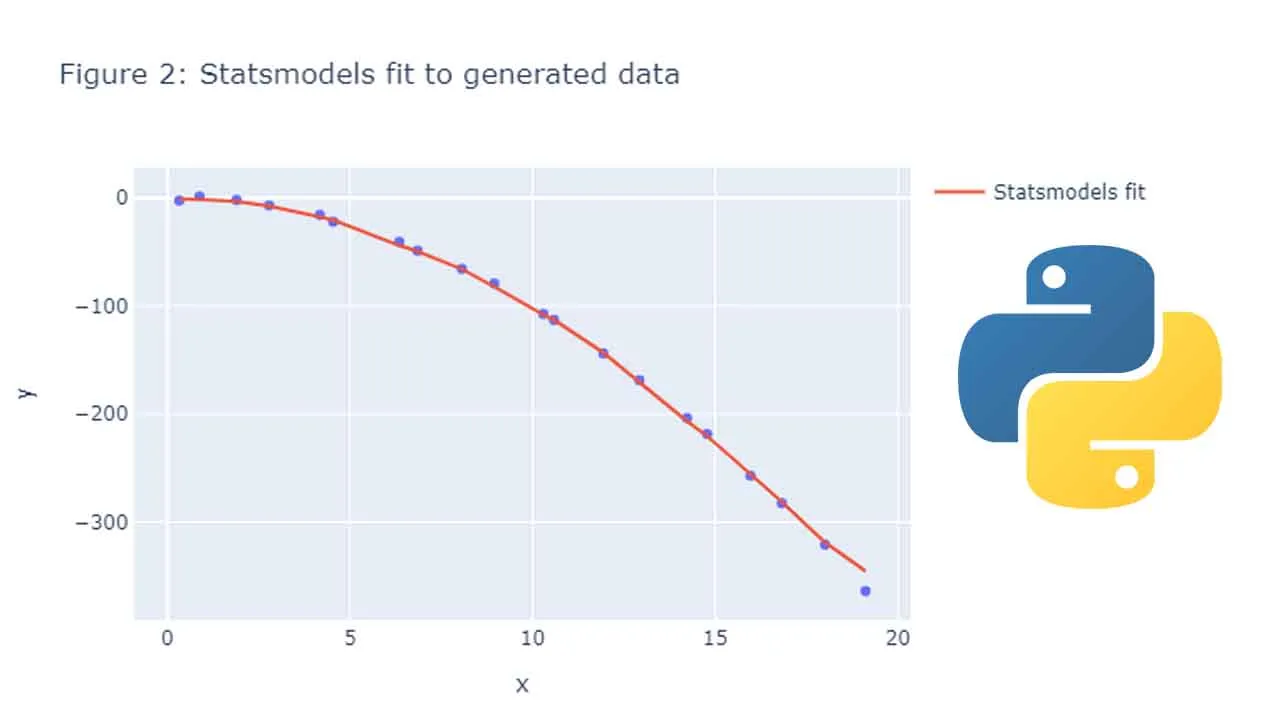
To begin with, lets looks at Kernel regression by Statsmodels
1 Kernal Regression by Statsmodels
We generate y values by using a lambda function. You can change the lambda function around to see what happens. The x values i.e. the independent variable is controlled by new_x where we have displaced the x value to show that you can have
1.1 Generating Fake Data
import numpy as np
import plotly.express as px
from statsmodels.nonparametric.kernel_regression
import KernelReg as kr
import plotly.graph_objs as go
import pandas as pd
1.1 Generating Fake Data
np.random.seed(1)

## xwidth controls the range of x values.
xwidth = 20
x = np.arange(0,xwidth,1)
## we want to add some noise to the x values so that dont sit at regular intervals
x_residuals = np.random.normal(scale=0.2, size=[x.shape[0]])
## new_x is the range of x values we will be using all the way through
new_x = x + x_residuals
## We generate residuals for y values since we want to show some variation in the data
num_points = x.shape[0]
residuals = np.random.normal(scale=2.0, size=[num_points])
## We will be using fun_y to generate y values all the way through
fun_y = lambda x: -(x*x) + residuals
#machine-learning #ai #regression-analysis #data-science #python