We found some interesting periodicity in the data. Call volume had 3 main seasonal trends: daily, 3x a day, and once a week. But seasonality doesn’t explain everything. History doesn’t exactly repeat itself. For example, tides ebb and flow throughout the day (this is seasonality), changing the water level, but every year, global warming increases the overall sea levels (unless we do something about it). If you were predicted the water level many many years into the future by just looking at the tide, you would underestimate the water level because you’re not accounting for how sea levels have risen over time.
Similarly, Montgomery County has seen its population increase by ~3.9% from 2010–19 so it’d be reasonable to assume that the 911 call volume has increased slightly in our data as well due to the increased population (we’ll find out if this is the case).
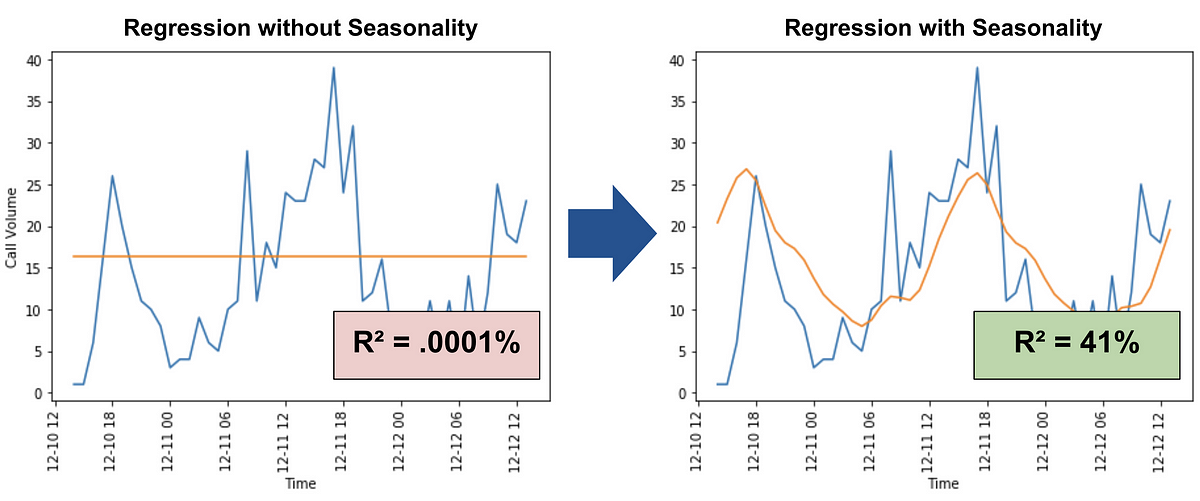
To address this, we’re going to make one big change from how we analyzed seasonality last time. We’ll first run a linear regression and then perform a Fourier transform on the residuals—the errors of the first regression.
What we’re doing is giving our best shot trying to explain the data without using seasonality, and then we’ll use seasonality to explain whatever we can’t explain. So let’s get started.
#programming #python #data-science #math #machine-learning