How to Create Interactive Charts in Django Admin with Chart.js
In this tutorial, you will learn how to create interactive charts in Django admin with Chart.js, a popular JavaScript library for creating charts and graphs.
The Django web framework offers a built-in administration interface for managing a web application’s data. However, by default, the Django admin interface provides only a list view of this data, with the ability to filter, sort, and search the data. But, sometimes, it’s helpful to display data in a graphical format, for example, using a chart.
In this article, we‘ll learn how to add charts to the Django admin interface using Chart.js, a popular JavaScript library for creating charts and graphs. First, we’ll update the Django admin by creating a new admin view that will render the chart. Then, we’ll use Chart.js to create the chart using data provided by the app.
Chart.js offers a wide range of chart types, including bar charts, line charts, and pie charts, as well as customization options to help you create the perfect chart for your needs. Once the chart is created, it will be embedded in the Django admin page and will update automatically as the data in the app changes, allowing you to gain new insights into your data and make more informed decisions.
Contents:
- Develop Django application
- Developing the models
- Customizing admin templates
- Update the
Admin.pyfile
- Update the
- Configure Chart.js on Django
- Display the chart with Chart.js
Develop a Django application
First, we’ll develop the model that we’ll use to test the chart. For this tutorial, we‘ll build a blog application where users can create articles and save them in a database. Since we’ll be working only with the Django admin, we’ll only create the models for this application.
To begin, first create a project folder called django-chartjs. Then, create a virtual environment by running the following command:
python3 -m venv venvActivate the virtual environment as follows:
python3 -m venv/bin/activateNow, install Django:
$(venv) pip install djangoNow that we have Django installed, we’ll create a new Django project by running the following command:
django-admin startproject project .
python3 manage.py startapp app
Add the app you just created to your settings.py file:
INSTALLED_APPS = [
   ...
    "django.contrib.staticfiles",
    "app"
]
Developing the models
Like I mentioned earlier, our application will allow writers to create new articles. So, we’ll have two models, one for the writer and one for the article details. Open your app/models.py file and paste the following code:
from django.db import models
class Writer(models.Model):
    name = models.CharField(max_length=200)
    createdDate = models.DateTimeField(auto_now_add=True)
    def __str__(self):
        return u'%s' % (self.name)

class Article(models.Model):
    text_title = models.CharField(max_length=50, null=True, blank=True)
    text = models.TextField(max_length=200, null=True, blank=True)
    refWriter = models.ForeignKey(Writer, on_delete=models.CASCADE)
    createdDate = models.DateTimeField(auto_now_add=True)
    def __str__(self):
        return u'[%s] : %s' % (self.refWriter,self.text_title)
To set up the database, run the following migration commands:
python manage.py makemigrations
python manage.py migrate
Customizing admin templates
When Django is installed, a folder is created in the virtual environment that contains all the files required to build a Django application, including the HTML for the admin page. To edit a Django admin page, you need to get the HTML file from the Django folder in the virtual environment into your Django project.
Doing so will override the admin HTML file in the Django folder in the virtual environment. Since we’ll be working on the list page, we’ll need the venv/lib/python3.10/site-packages/django/contrib/admin/templates/admin/change_list.html file.
To get started, in the root of your project, create a directory with the templates/admin/ path. In the admin directory you just created, create a new file called change_list.html.
Now, copy the content in venv/lib/python3.10/site-packages/django/contrib/admin/templates/admin/change_list.html to templates/admin/change_list.html.
We need to add templates/ to the base directory of the Django project so that Django knows about that directory. Once that is done, the admin page will utilize templates/admin/change_list.html. Update your settings.py file with the code below:
import os
...
TEMPLATES = [
    {
        "BACKEND": "django.template.backends.django.DjangoTemplates",
        "DIRS": [
            BASE_DIR,
            os.path.join(BASE_DIR, 'templates')
        ],
...
Update the Admin.py file
We want to update the writer list page to display a chart based on the number of writers created by date.
When rendering the change_list.html page, Django uses a method called changelist_view(). We can override this method in the WriterAdmin class, which we’ll create later to implement the business logic.
Now, let’s update the app/admin.py file to implement this logic and get the respective data in JSON. Paste the following code in your admin.py file:
from django.contrib import admin
from app.models import *
from django.db.models.functions import TruncDay
from django.db.models import Count
from django.core.serializers.json import DjangoJSONEncoder
import json

# Register your models here.
class WriterAdmin(admin.ModelAdmin):
    # change_list.html
    def changelist_view(self, request, extra_context=None):
        # Aggregate new authors per day
        chart_data = (
            Writer.objects.annotate(date=TruncDay("createdDate"))
            .values("date")
            .annotate(y=Count("id"))
            .order_by("-date")
        )
        # Serialize and attach the chart data to the template context
        as_json = json.dumps(list(chart_data), cls=DjangoJSONEncoder)
        print("Json %s"%as_json)
        extra_context = extra_context or {"chart_data": as_json}
        # Call the superclass changelist_view to render the page

        return super().changelist_view(request, extra_context=extra_context)

admin.site.register(Writer, WriterAdmin)
admin.site.register(Article)
The code above is a Django admin view that aggregates new authors each day and attaches the data to the template context as a JSON object. The WriterAdmin class overrides the changelist_view method to add the chart data to the context, and the super().changelist_view method is called to render the page. The Writer and Article models are also registered with the admin site.
Configure Chart.js on Django
To configure Chart.js to display the desired chart, we’ll first bring in the JavaScript and CSS files for Chart.js. Paste the following code below the first {{ block.super }} tag you see in templates/admin/change_list.html:
<link rel="stylesheet" href="https://cdnjs.cloudflare.com/ajax/libs/Chart.js/2.8.0/Chart.min.css"/>
<script src= "https://cdnjs.cloudflare.com/ajax/libs/Chart.js/2.8.0/Chart.bundle.min.js"> </script>
Display the chart with Chart.js
Now, we’ll implement the logic to display the chart we want using the data retrieved from the admin.py file. We’ll add an event listener to the document that waits for the DOMContentLoaded event to fire.
Once the event fires, it retrieves the 2D context of an HTML canvas element with the myChart ID and a chartData variable that is passed in from a Django template. It then parses the dates in the chartData to JavaScript Date objects. Finally, it creates a new Chart.js chart using the 2D context, chartData, and some configuration options, like the type of chart, background color, scales, and tick options.
The chart will be rendered on the canvas element with the ID myChart, which we’ll implement later. To implement this, paste the following code above the last {% endblock %} template tag:
 <script>
    document.addEventListener('DOMContentLoaded', () => {
        const ctx = document.getElementById('myChart').getContext('2d');
        const chartData = {{ chart_data | safe }};

        // Parse the dates to JS
        chartData.forEach((d) => {d.x = new Date(d.date);});

        // Add your javascript chart presentation below this comment
        var myChart = new Chart(ctx, {
          type: 'bar',
          data: {
              datasets: [{
                  label: 'number of writers',
                  data: chartData,
                  backgroundColor: 'rgba(61,61,131,0.5)',
              }]
          },
          options: {
              responsive: true,
              scales: {
                  xAxes: [{
                      type: 'time',
                      time: {
                          unit: 'day',
                          round: 'day',
                          displayFormats: {
                              day: 'MMM D',
                          },
                      },
                  }, ],
                  yAxes: [{
                      ticks: {
                          beginAtZero: true,
                      },
                  }, ],
              }
          }
      });

    });
    </script>
Paste the following code in the position you want your chart to be displayed. For this tutorial, we’ll put it above the writers list by pasting the following code above the<div id="content-main"> tag in templates/admin/change_list.html:
<canvas id="myChart" width="400" height="50"></canvas>Now that all the configuration is complete, you need a superuser to access the admin page of your project. You can create a superuser with the following command:
python manage.py createsuperuserStart the Django application by running the following command:
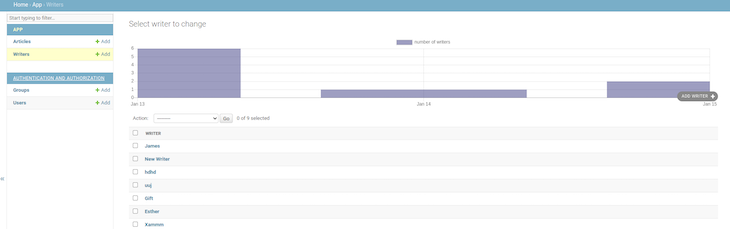
python manage.py runserverYou can access the admin on http://127.0.0.1:8000/admin using your superuser details. Create new writers with different dates, and you’ll see a chart showing the number of users created in a particular day:
Conclusion
In this article, we learned how to add charts to the Django admin interface using Chart.js, a chart library that is available as a JavaScript package. By creating a new admin view, you can use Chart.js to create a variety of chart types and customize them for your needs.
The chart will be embedded in the Django admin page and will automatically update with changing data, providing new insights for informed decisions.
Source: https://blog.logrocket.com
#chartjs #django #python