As you know, we introduce new chart types in almost all our releases. The 2020 Volume 3 release was rolled out last week. If you haven’t checked it out yet, have a look here. We included the following two new chart types in the Flutter Charts widget in this release:
- Waterfall chart
- Box and whisker chart
In this blog, I will walk you through how to create a waterfall chart and the features available in it. The box and whisker chart will be explained in an upcoming blog. In addition to these chart types, we have also implemented and included various new features in our Flutter Charts. You can find those details in this blog: What’s New in 2020 Vol 3: Flutter Charts.
Let’s explore the features of the waterfall chart!
Overview
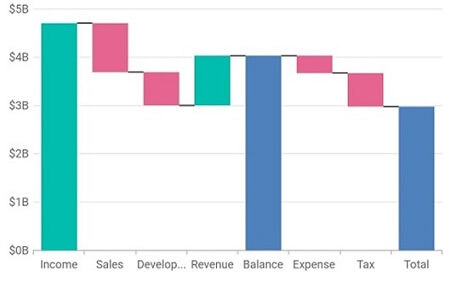
The new Flutter waterfall chart shows gradual changes in the quantitative value of an entity that is subject to changes by increments or decrements. Using the waterfall chart, you can quickly illustrate changes in revenues.
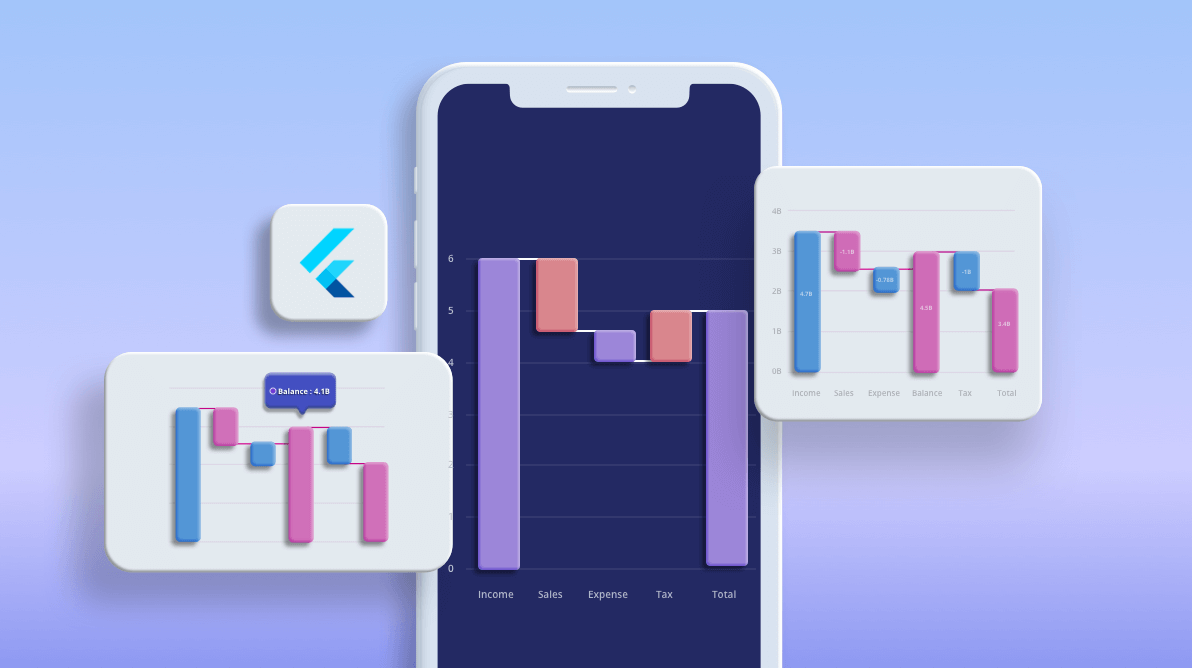
 Waterfall chart
This will be helpful in understanding the details of the dynamic data quickly. The data point can be either a positive or negative value.
#chart #flutter #data visualization