Monitoring SQL Server for performance is a critical part of a DBA’s job. In this article, Edward Pollack explains some of the SQL Server performance monitor data and how to collect it.
Windows collects a wide array of useful metrics that can be used to measure the performance of the SQL Server service. By default, this data is available but not collected or retained in SQL Server. Therefore, it falls to a developer or administrator to choose to collect and use this data for performance analysis if they don’t have a tool like SQL Monitor to do it for them. This article introduces the performance monitor view, the data contained within it and prepares the reader to build a data collection solution that uses SQL Server performance monitor data. Introducing dm_os_performance_counters
The view sys.dm_os_performance_counters will be front and center in this article, providing more information than there are pages to cover. The following is a subset of results when selecting everything from the view:
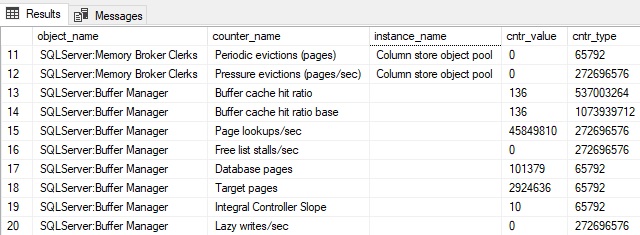
Each row represents a single performance counter and its measurement. Some are server-scoped, and others are database-scoped. A database-level performance counter will include the database name in the instance_name column, like this:
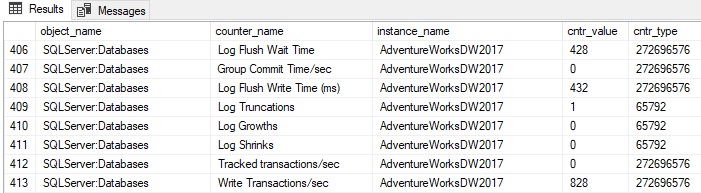
The instance_name column can contain an empty string but not NULL, so checking for a database name or other metadata is straightforward.
#performance #sql #sql server