Introduction
The need for Prometheus High Availability
Kubernetes adoption has grown multifold in the past few months and it is now clear that Kubernetes is the defacto for container orchestration. That being said, Prometheus is also considered an excellent choice for monitoring both containerized and non-containerized workloads.
Monitoring is an essential aspect of any infrastructure, and we should make sure that our monitoring set-up is highly-available and highly-scalable in order to match the needs of an ever growing infrastructure, especially in the case of Kubernetes.
Therefore, today we will deploy a clustered Prometheus set-up which is not only resilient to node failures, but also ensures appropriate data archiving for future references. Our set-up is also very scalable, to the extent that we can span multiple Kubernetes clusters under the same monitoring umbrella.
Present scenario
Majority of Prometheus deployments use persistent volume for pods, while Prometheus is scaled using a federated set-up. However, not all data can be aggregated using a federated mechanism, where you often need a mechanism to manage Prometheus configuration when you add additional servers.
The Solution
Thanos aims at solving the above problems. With the help of Thanos, we can not only multiply instances of Prometheus and de-duplicate data across them, but also archive data in a long term storage such as GCS or S3.
Implementation
Thanos Architecture
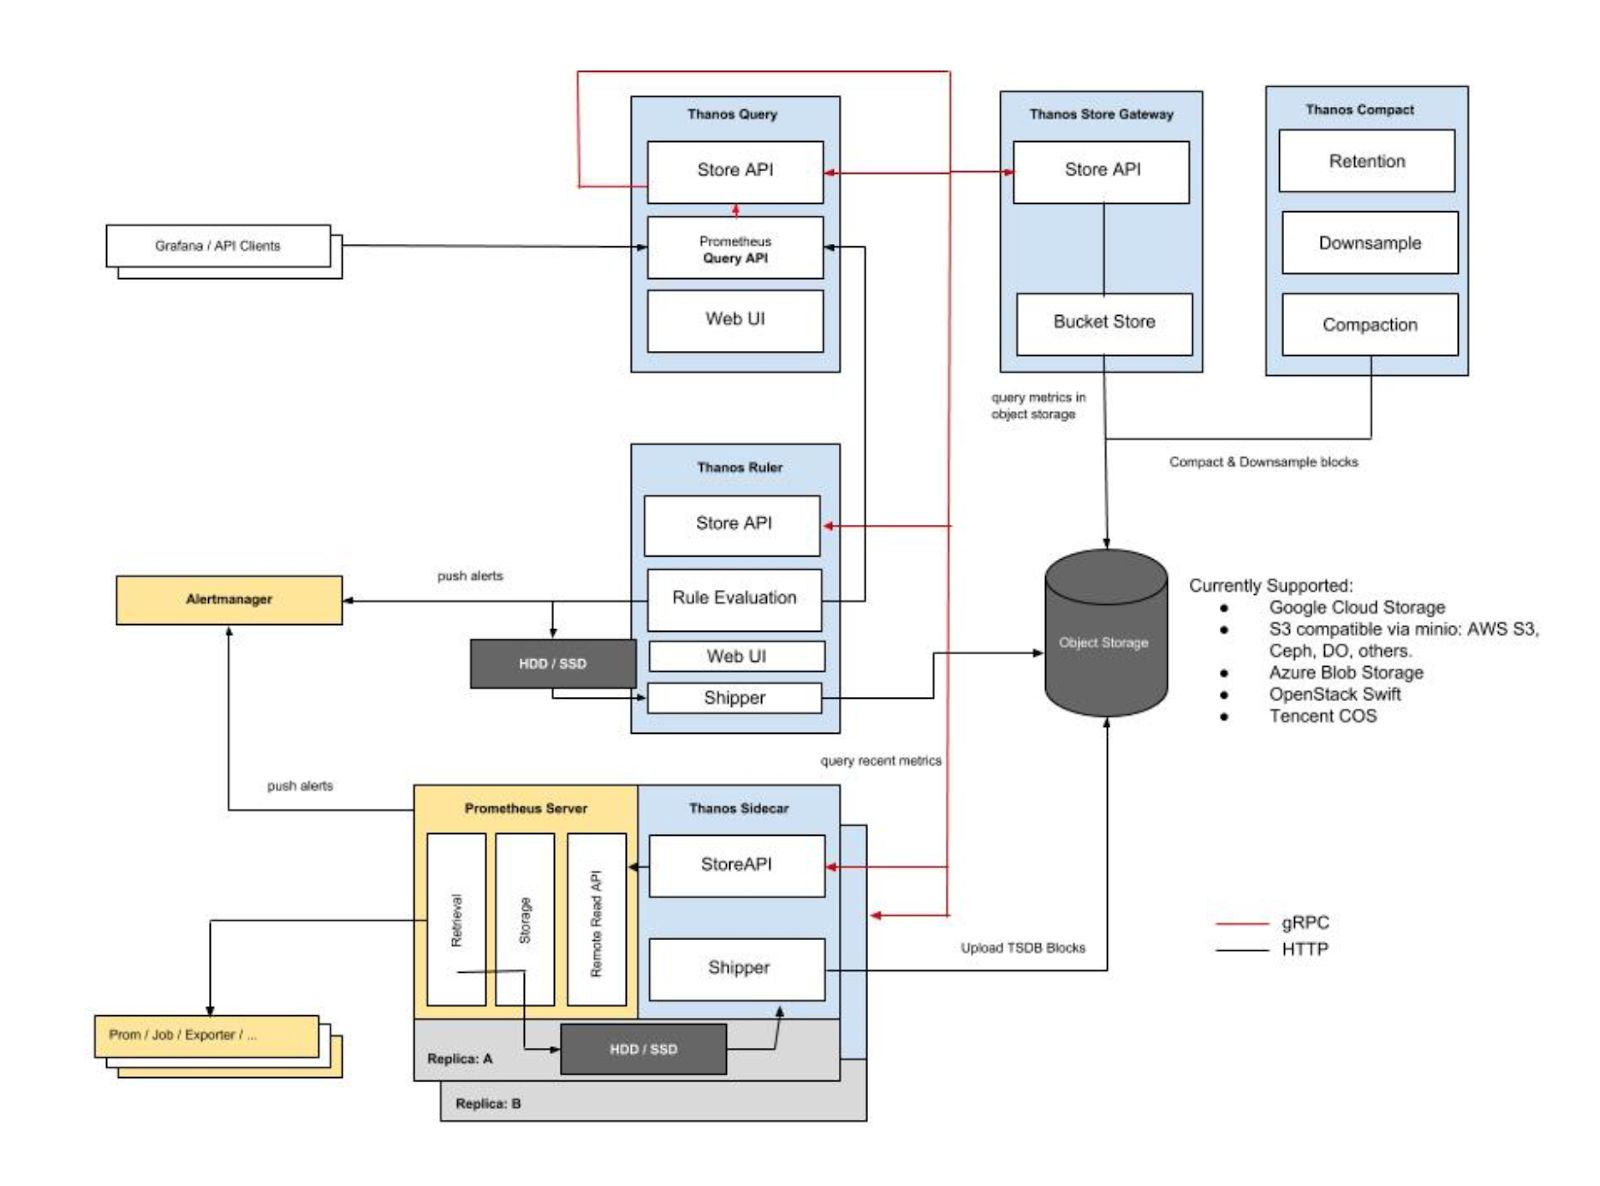
Image Source: https://thanos.io/quick-tutorial.md/
Thanos consists of the following components:
- Thanos Sidecar: This is the main component that runs along Prometheus. It reads and archives data on the object store. Moreover, it manages Prometheus’ configuration and lifecycle. To distinguish each Prometheus instance, the sidecar component injects external labels into the Prometheus configuration. This component is capable of running queries on Prometheus servers’ PromQL interface. Sidecar components also listen on Thanos gRPC protocol and translate queries between gRPC and REST.
- Thanos Store: This component implements the Store API on top of historical data in an object storage bucket. It acts primarily as an API gateway and therefore does not need significant amounts of local disk space. It joins a Thanos cluster on startup and advertises the data it can access. It keeps a small amount of information about all remote blocks on local disk and keeps it in-sync with the bucket. This data is generally safe to delete across restarts at the cost of increased startup times.
- Thanos Query: The Query component listens on HTTP and translates queries to Thanos gRPC format. It aggregates the query result from different sources, and can read data from Sidecar and Store. In a HA setup, it even deduplicates the result.
Run-time deduplication of HA groups
Prometheus is stateful and does not allow replicating its database. This means that increasing high-availability by running multiple Prometheus replicas are not very easy to use. Simple load balancing will not work, as for example after some crash, a replica might be up but querying such replica will result in a small gap during the period it was down.
You have a second replica that maybe was up, but it could be down in another moment (e.g rolling restart), so load balancing on top of those will not work well.
- Thanos Querier instead pulls data from both replicas, and deduplicate those signals, filling the gaps if any, transparently to the Querier consumer.
- Thanos Compact: The compactor component of Thanos applies the compaction procedure of the Prometheus 2.0 storage engine to block data stored in object storage. It is generally not semantically concurrency safe and must be deployed as a singleton against a bucket.
- It is also responsible for downsampling of data - performing 5m downsampling after 40 hours and 1h downsampling after 10 days.
- Thanos Ruler: It basically does the same thing as Prometheus’ rules. The only difference is that it can communicate with Thanos components.
Configuration
Prerequisite
In order to completely understand this tutorial, the following are needed:
- Working knowledge of Kubernetes and using kubectl
- A running Kubernetes cluster with at least 3 nodes (for the purpose of this demo a GKE cluster is being used)
- Implementing Ingress Controller and ingress objects (for the purpose of this demo Nginx Ingress Controller is being used). Although this is not mandatory but it is highly recommended inorder to decrease the number of external endpoints created.
- Creating credentials to be used by Thanos components to access object store (in this case GCS bucket)
- Create 2 GCS buckets and name them as prometheus-long-term and thanos-ruler
- Create a service account with the role as Storage Object Admin
- Download the key file as json credentials and name it as thanos-gcs-credentials.json
- Create kubernetes secret using the credentials
kubectl create secret generic thanos-gcs-credentials --from-file=thanos-gcs-credentials.json -n monitoring
Deploying various components
Deploying Prometheus Services Accounts, Clusterrole and Clusterrolebinding
apiVersion: v1
kind: Namespace
metadata:
  name: monitoring
---
apiVersion: v1
kind: ServiceAccount
metadata:
  name: monitoring
  namespace: monitoring
---
apiVersion: rbac.authorization.k8s.io/v1beta1
kind: ClusterRole
metadata:
  name: monitoring
  namespace: monitoring
rules:
- apiGroups: [""]
  resources:
  - nodes
  - nodes/proxy
  - services
  - endpoints
  - pods
  verbs: ["get", "list", "watch"]
- apiGroups: [""]
  resources:
  - configmaps
  verbs: ["get"]
- nonResourceURLs: ["/metrics"]
  verbs: ["get"]
---
apiVersion: rbac.authorization.k8s.io/v1beta1
kind: ClusterRoleBinding
metadata:
  name: monitoring
subjects:
  - kind: ServiceAccount
    name: monitoring
    namespace: monitoring
roleRef:
  kind: ClusterRole
  Name: monitoring
  apiGroup: rbac.authorization.k8s.io
---
The above manifest creates the monitoring namespace and service accounts,
clusterrole
and
clusterrolebinding
needed by Prometheus.
#k8s #kubernetes #containers #monitoring #prometheus #thanos #aws #grafana