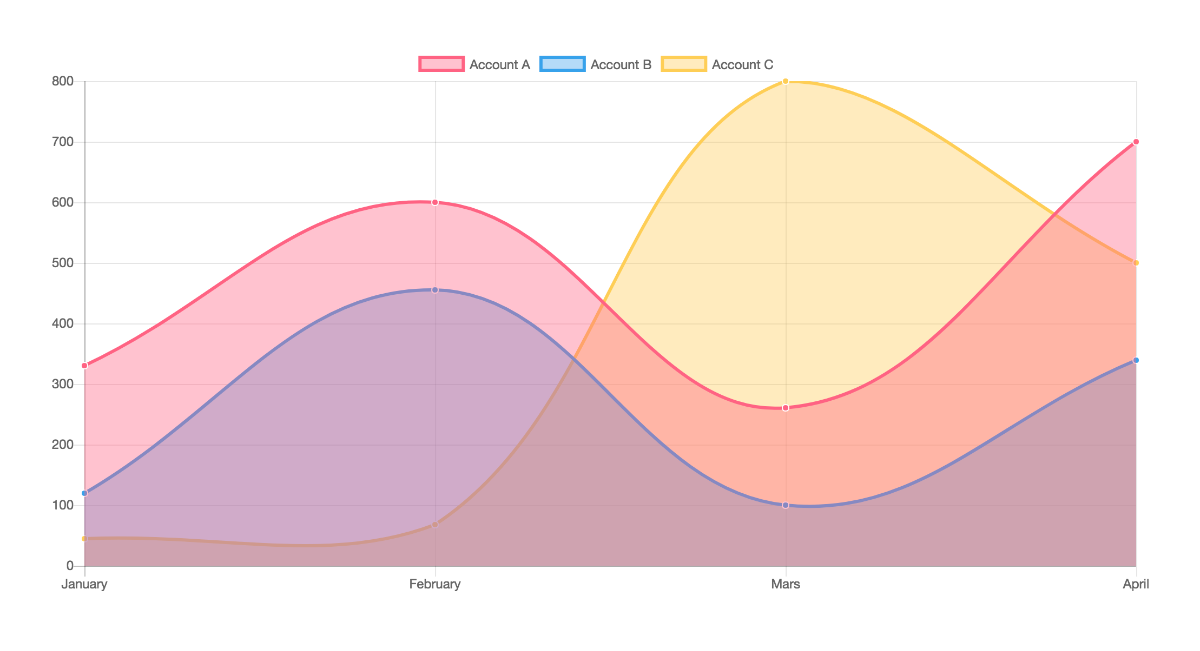
If you have ever tried to add a chart to a website, you know what a nightmare it is. Even though we manage to add them, we need to spend hours with CSS, customising it to show our data in detail. Since a chart is a graphical representation of data. it needs to be informative and easy to understand. Achieving that might be a challenge. But don’t worry — I’ve got the perfect solution for you. I assure you that by the end of this article, adding charts to your site will be the easiest thing you have ever done.
Let me start with a brief introduction to how I found this. It’s been six weeks since my internship at Rootcode Labs started, and I’m working on this cool project that needs charts to show some important data. Then I started to research adding charts, and that’s when I got to know about Chart.js.
#chartjs #javascript #programming #open-source #html
