The Confidence Interval (CI) is very important in statistics and data science. In this article, I am going to explain the confidence interval, how to calculate it, and the important characteristics of it.
The confidence interval (CI) is a range of values. It is expressed as a percentage and is expected to contain the best estimate of a statistical parameter. A confidence interval of 95% mean, it is 95% certain that our population parameter lies in between this confidence interval.
Interpretation of confidence intervals
Here is a statement:
“In a sample of 659 parents with toddlers, 540, about 85 percent, stated they use a car seat for all travel with their toddler. From these results, a 95% confidence interval was provided, going from about 82.3 percent up to 87.7 percent.”
This statement means, it is 95% certain that the population proportion that uses a car seat for all travel with their toddler is 82.3 and 87.7. If we take several subsamples from this population, 95% of the time, the population proportion that uses a car seat for all travel with their toddler will fall between 82.3% to 87.7%.
Can we say that the confidence interval (82.3, 87.7) contains the true population proportion? The answer is unknown. The population proportion is a fixed value but unknown. It is important to remember that 95% confidence does not mean a 95% probability.
Why Confidence Interval Is Important?
It is important because it is not possible to take data from every single person in a population most of the time. In the example above, the sample size was 659. We estimated the population proportion of the parents with toddlers who use a car seat for all travel from a sample of 659 parents. We could not get the data from all the parents with toddlers. So, we calculate the population proportion from our available sample and consider a margin of error. With that margin of error, we get a range. This range is called a confidence interval. A confidence interval is a way to express how well the sample data represent the total population. You can calculate a confidence interval of any number(less than 100%). But a 95% confidence interval is the most common.
How to Calculate the Confidence Interval
The formula for the confidence interval is:

We normally want a high confidence level such as 75%, 95%, or 99%. Higher the confidence level(CL), lower the precision. In the example above, the best estimate is 85%. We can calculate the estimates SE from the following formula:
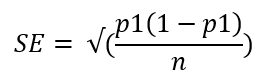
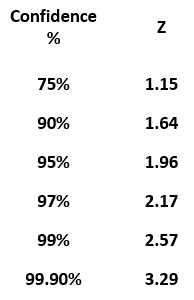
In the equation, above p1 is the best estimate and n is the sample size. Here is a table for z- score for a few commonly used confidence level.
Plugging in all the values,
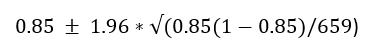
The confidence interval come out to be 82.3% and 87.7%.
The range of CI is higher for higher CL
In the same way, we can calculate a 99% confidence level. You only need to change the z-score. From the table above, the z-score for a 99% confidence level is 2.57. Plugging in that value in the confidence interval formula, the confidence interval for a 99% confidence level is 81.43% to 88.57%. The range of a confidence interval is higher for a higher confidence level.
#statistical-analysis #confidence-interval #statistics #statistical-learning #data-science #data analysis