Over the past few years, data jobs have proliferated across the world, becoming some of the most sought-after and well-paid jobs. As technology continues to evolve, new jobs are being created to meet business needs. In parallel, the hard skills and technologies required to get these jobs have also ballooned. Such technologies sometimes include unfamiliar names such as “Hadoop”, “MapReduce” or “Blue Prism”, making it a bit hard to keep track of which tool does what, and which is required for what.
In this post, **I explore ~9,000 job postings from Glassdoor to understand how three prominent data jobs **— Data Analyst, _Data Scientist, _and _Data Engineer — _differ in what skills they require: data science domains, specific technologies and soft skills.
The outline of this blog post is as follows:
- Methodology
- Comparison #1: How do data science domains differ across the three roles?
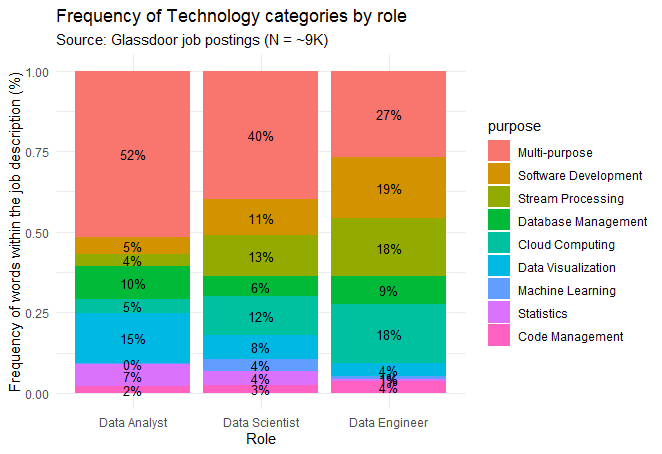
- Comparison #2: How does the required technology differ across the three roles?
- Comparison #3: How do soft skills differ across the three roles?
- [Bonus] Additional descriptive statistics: How do salaries differ across the three roles? Which companies provide the most used software? Is the technology open source or proprietary?
Methodology
1. Understanding the Data Source
My underlying data comes from recently scraped data from Glassdoor, and made available on Github by the user picklesueat, for three positions:
- Data Analyst, containing ~2,200 job postings.
- Data Scientist, containing ~3,900 job postings.
- Data Engineer, containing ~2,500 job postings.
All three datasets come in .csv files and contain organized information about the job postings, most notably: Job Title, Job Description, Location, Salary Estimate (as a range), Industry and Sector.
For the purposes of this post, I clean two variables: Job Description and Salary Estimate:
- Job Description: I use the tidytext package in R to “tokenize” Job Description; that is, to separate all words within every single job description in order to extract which words appear with the highest frequency. The challenge that presented itself is that a lot of skills are in fact two words. For example: “critical thinking” or “Apache Hadoop” are skills that only make sense if the two words are grouped together, because “critical” or “Apache” as stand-alone words do not mean much. Therefore, I iteratively identified the most frequent collection of words, created a union of these words (e.g., “critical thinking” became “criticalthinking”) so that the tidytext package could identify them as stand-alone words. After this cleaning process is complete, I remove the most frequent grammar words (e.g., “and”, “I”, “what”) to obtain a list of the most frequent and relevant words that appear in the “Job Description” variable.
- Salary Estimate: Because these job postings are scraped from Glassdoor, their associated salaries are wide ranges that cannot be easily grouped together. For example, three job postings have these three ranges in the salary estimate variable: (37K-66K), (46K-87K), (51K-88K). If I were to take the lower and upper bound for these three posts, the ensuing range would be too wide (37K-88K). Therefore, I created a lower salary range and upper salary range for each job posting. That is, in the example above, the lower salary range is 37K-51K and the higher salary range is 66K-88K.
After I clean these two variables, the next steps is to categorize and sub-categorize the most frequent words into the following large categories:
- Data Science Domains to understand the actual tasks required of the three roles.
- Technology Skills to understand which programming languages or software are required for the three roles
- Soft Skills
2. Creating a Data Science Domains Taxonomy
I found this figure from Analytics Vidhya very helpful to understand and differentiate between the different “domains” that constitute data science.
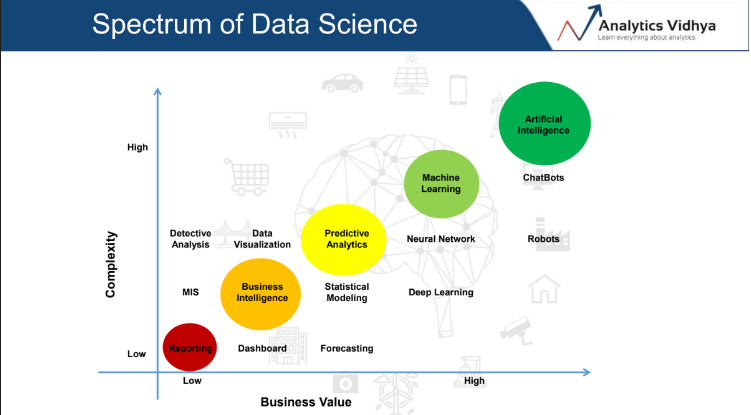
I therefore use this categorization to organize words from the job descriptions to fit into the categories above. I also add two other categories which are missing from the figure above: _ETL (Extract, Transform, Load) _and Cloud Computing, as they are both widely used for the Data Engineer role (and to some extent the other roles as well).
See below examples of which words from the job postings datasets are within which category:
- **Reporting: **reports, financial reporting.
- **Business Intelligence: **visualization, dashboards, interactive, BI.
- **Predictive Analytics: **modeling, statistical, forecasting, predictive, models, statistics.
- **Machine Learning: **ML, deep learning, neural networks.
- Artificial Intelligence: AI, chatbot, natural language processing.
- **ETL: **mining, warehousing, extract, transform, load.
- **Cloud Computing: **cloud.
3. Creating a Data Technology Taxonomy
After creating the data science domains taxonomy, I also identify the most widely used data science programming languages or / and software, and categorize them. As a base for recognizing these technologies within the job descriptions of my database, I use a list from this source (written by Angela Stringfellow), which identifies and defines 50 data science tools. After I understand the most widely-used tools, I create categories for them based on my research and understanding. These categories, which I denote as “Purpose”, are as follow:
- Database Management, (e.g., SAP, Oracle Database, MongoDB)
- Data Stream Processing, (e.g., Hadoop, Hive, Kafka, Kinesis)
- Multi-purpose, used to extract, clean, analyze (e.g., Python, R, SQL, alteryx)
- Software Development, (e.g., JavaScript, Docker, Java)
- Cloud Computing, (e.g., Azure, AWS, Google BigQuery)
- Machine Learning / AI, (e.g., TensorFlow, PyTorch, Keras, NLT)
- Statistics, (e.g., SAS, Stata, MATLAB)
- Code Management, (e.g., Github, Jira, Jupyter)
- Data Storage, (e.g., XML, JSON)
- Data Visualization, (e.g., Tableau, Power BI, Looker, Shiny — R)
#skills #learning #data-analysis #data-science #technology #data analysisa