Hello Everyone!!
Let’s have a quick glance on the Categorical plots in python. This blog will explain you about What are Categorical plots and The various types of Categorical plots that are present in Python.
Let’s get started!!
What are Categorical Plots???
As we all know that Python provides various plotting techniques and various libraries , one such library is Seaborn.
**Seaborn **besides being a statistical plotting library also provides some default datasets. We will be using one such default dataset called ‘iris’.
Categorical Plots are the plots that consists of more than one category of data.
Types of Categorical Plots

The various forms of Categorical Plots are as follows:
- barplot
- countplot
- boxplot
- violinplot
- striplot
- swarmplot
- factorplot
Let’s have a look on each one of the them one by one:
Firstly, Import the necessary Libraries:
import numpy as np
import pandas as pd
import matplotlib.pyplot as plt
import seaborn as sb
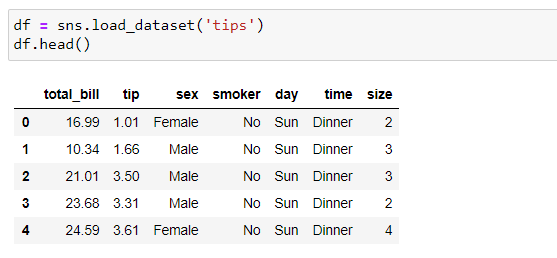
Now, Load the dataset ‘iris’ from Seaborn:
#python #internity-foundation #data-analytics #plot