DataFrames in Python
A DataFrame is a two-dimensional data container, similar to a Matrix, but which can contain heterogeneous data, and for which symbolic names may be associated with the rows and columns. In this post, we learn about DataFrames and how it works
Dataframes are going to be the main tool when working with pandas.
Prerequisites
Python Pandas should be installed in the system, else, you can install it using,
pip install pandas
(If you have installed python directly by going herenloadshttps://www.python.org/downloads/))
OR
conda install pandas
(if you have Anaconda distribution of python)
DataFrames and how they interact with pandas
DataFrames are the workhorse of pandas and are directly inspired by the R programming language. We can think of a DataFrame as a bunch of Series objects put together to share the same index. Let’s use pandas to explore this topic.
import pandas as pd
import numpy as np

from numpy.random import randn
np.random.seed(101)
To generate some random numbers, we use seed here.
Let’s create a dataframe now,
df = pd.Dataframe
If you are using jupyter notebook, press shift+tab after df = pd.Dataframe, and you will see this,

Check out the docstring and the initial signature for this PD dataframe. We have a data argument, index argument just like Series but then we have this additional Columns argument.
Let’s go ahead and create it with some random data and we’ll see what a dataframe actually looks like. For data argument, we are using randn(5,4) ; for index argument, we are using a list of characters and for columns argument, we are using another list of characters.
df = pd.DataFrame(randn(5,4),['A','B','C','D','E'],['W','X','Y','Z'])
df
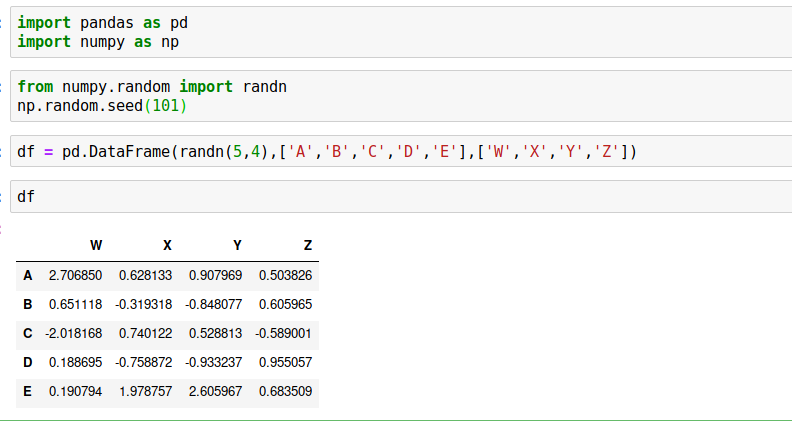
So, basically what we have here is a list of columns w x y z and corresponding rows A B C D E. Each of these columns is actually a panda series such as W or X or Y or Z and they all share a common index. Data frame is a bunch of series that share an index.
Selection and Indexing
Let’s grab data from a DataFrame.
Selecting columns
df['W']
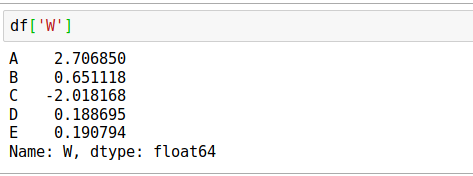
You can check the type using,
type(df['W'])
which will give pandas.core.series.Series result.
You can also check,
type(df)
which will give pandas.core.frame.DataFrame result
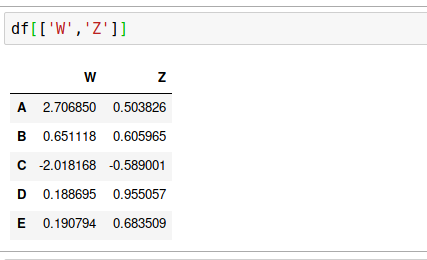
If you want to select multiple columns,
df[['W','Z']]
Creation of New Columns
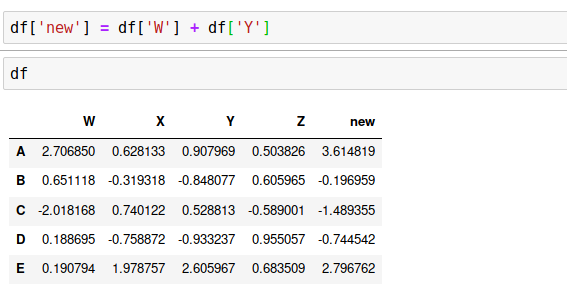
For creating a new column from the summation of already existing columns, use,
df['new'] = df['W'] + df['Y']
Removing Columns
For removing columns, you can just do,
df.drop('new',axis=1)
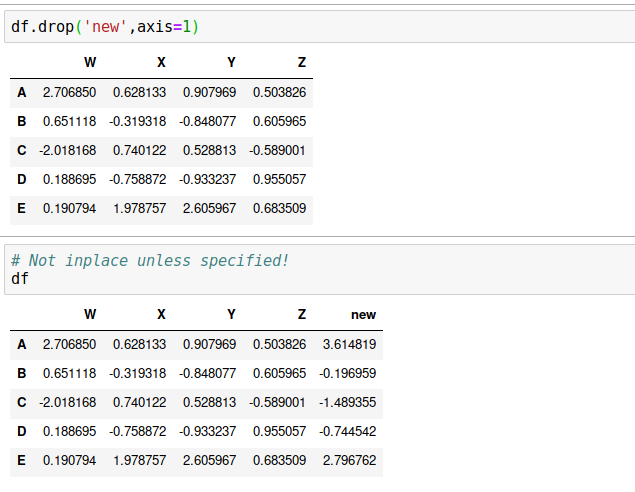
Here, you can use shift + tab to check what axis actually refers to. Axis = 0, which is by default is for rows, whereas, Axis = 1 refers to columns. So, here we use axis=1 because we wanted to drop a column.
Note: ‘new’ column still exists, because pandas has this special property, you have to use ‘inplace’ argument to retain this change. The reason pandas does that is because it does not want you to accidentally lose information. So, use inplace=True.
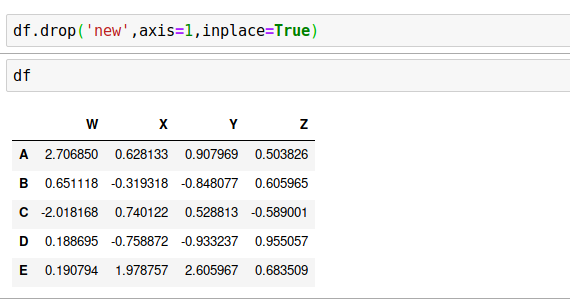
We can also use df.drop(‘E’,axis=0) to drop a row. Try it yourself.
df.drop('E',axis=0)
A Quick Question: Why are the rows 0 and why are the columns 1?
The reference actually comes back to numpy. Data frames are essentially index markers on top of a numpy array. Use df.shape() which results a tuple (5, 4). For a two-dimensional matrix, at the 0 index are the number of rows (A,B,C,D,E) and then on the index 1 are columns (W,X,Y,Z); which is why rows are referred to as the 0 axis and columns are referred to as 1 axis because it’s directly taken from the shape same as numpy array.
Selecting rows
There are two ways to select rows in a data frame and you have to call a dataframe method for this.
Select based on label
df.loc['A']
OR
Select based on the position
df.iloc[2]
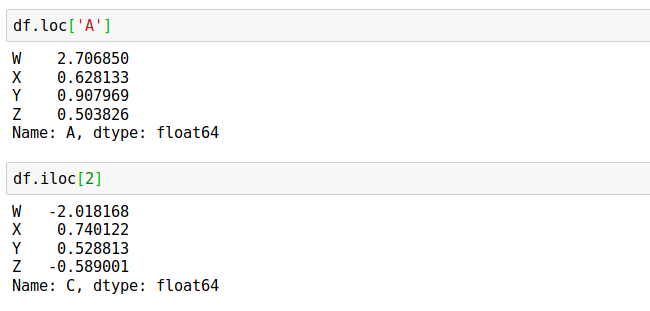
Note Not only are all the columns series but the rows are series as well.
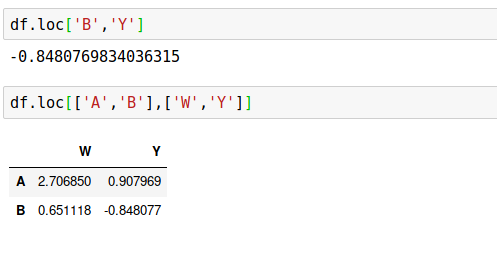
Selecting subsets of rows and columns
For this use,
df.loc[['A','B'],['W','Y']]
For selecting a particular value, use,
df.loc['B','Y']
Conditional Selection
A very important feature of pandas is the ability to perform conditional selection using bracket notation and this is going to be very similar to numpy.
Let’s use comparison operator,
df > 0
Result is a dataframe with boolean values, which returns true if the data frame value at that position is greater than zero and false if it is not greater than zero. See below,
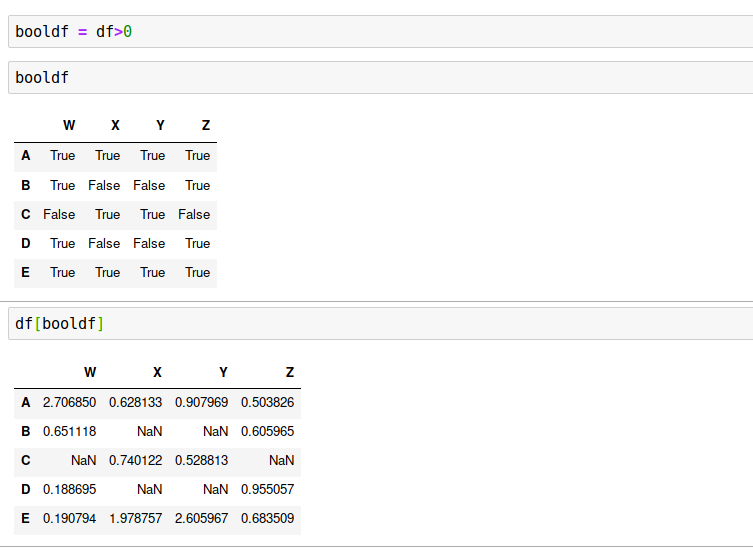
df[df>0]
As you can see wherever the value is negative, not satisfying the condition, a NaN has been returned.
Now, what is important is, instead of returning NaN we will return only the rows or columns of a subset of the data frame where the conditions are true.
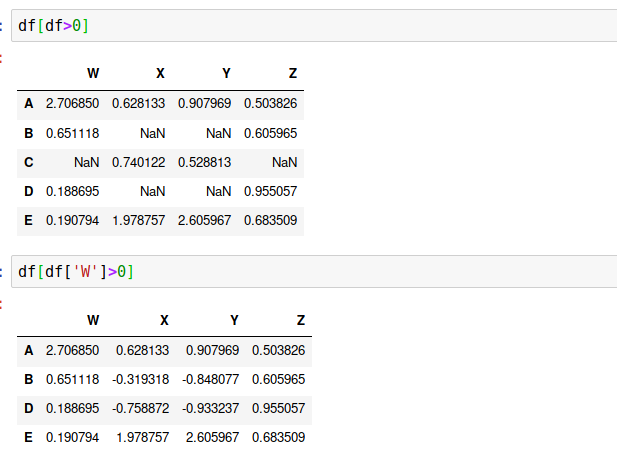
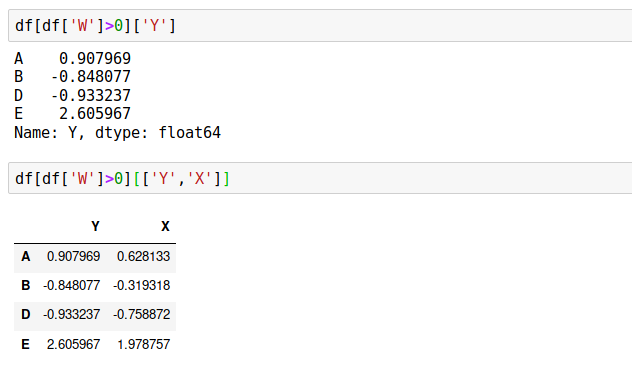
Let’s say we want to grab the data frame where the column value is W>0 and we want to extract Y column. We can also select a set of columns such as Y and X, after applying the condition. See below,
Using multiple conditions
For more than one condition, we can use | or &. Remember that we cannot use python’s and/or here.
df[(df['W']>0) & (df['Y'] > 1)]

Resetting the index
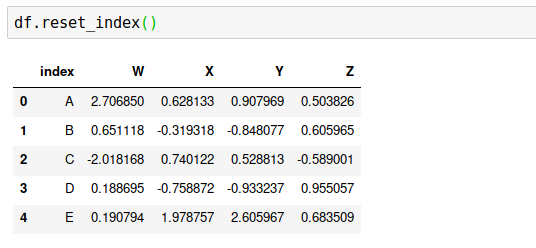
In order to reset the index back to the default which is 1234…n, we use the method reset_index(). We will get the index, reset to a column and the actual index converted to a numerical. But it will not retain the change if you don’t use inplace=True. Pandas use this inplace argument in many areas, just shift+tab(if using jupyter notebook) and you will get to see it.
df.reset_index()
Setting a new index
For setting a new index, first, we have to create a new index. We are using the split() method of a string, which is just a common method for splitting off a blank space. It’s a quick way to create a list,
newind = 'WB MP KA TN UP'.split()
Now, put this list as a column of the dataframe.
df['States'] = newind
df
If we want to use this State column as the index, we should use,
df.set_index('States')
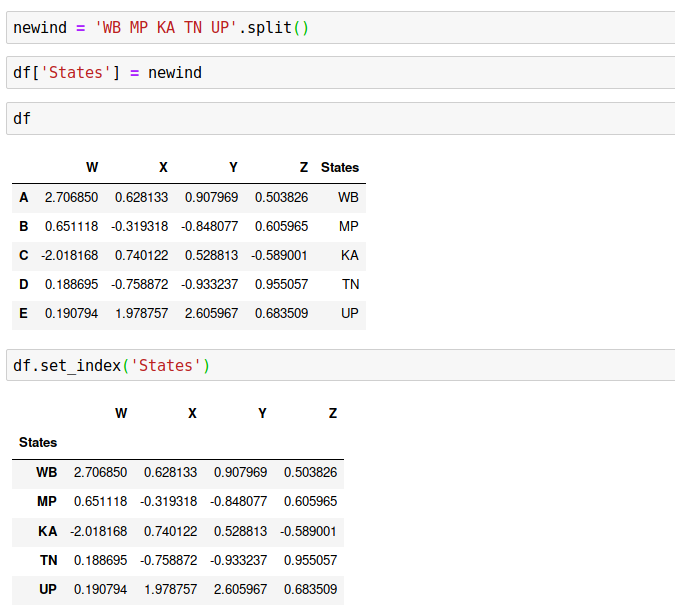
Note Unless we retain this information of the index it will overwrite the old index and we won’t actually be able to retain this information as a new column. Unlike resets index that allows us to have that new column.
So, that’s set index versus reset index.
Here also, inplace=True plays an important role.
Hope, you have enjoyed reading about DataFrames thus far. There’s more to come in an upcoming article on DataFrames with something more interesting.
Thank for reading!
#python #DataFrames #developer
