These statistical tests allow researchers to make inferences because they can show whether an observed pattern is due to intervention or chance. There is a wide range of statistical tests. The decision of which statistical test to use depends on the research design, the distribution of the data, and the type of variable.
In general, if the data is normally distributed, parametric tests should be used. If the data is non-normal, non-parametric tests should be used. Below is a list of just a few common statistical tests and their uses.
Correlational
These tests look for an association between variables.
1. Pearson Correlation
Tests for the strength of the association between two quantitative, continuous variables. Pearson’s correlation coefficient ® is a measure of the strength of the association between the two variables.
It is known as the best method of measuring the association between variables of interest because it is based on the method of covariance. It gives information about the magnitude of the association, or correlation, as well as the direction of the relationship.
The value r = 1 means a perfect positive correlation and the value r = -1 means a perfect negative correlation. So, for example, you could use this test to find out whether people’s height and weight are correlated (they will be — the taller people are, the heavier they’re likely to be).
Positive correlation indicates that both variables increase or decrease together, whereas negative correlation indicates that as one variable increases, so the other decreases, and vice versa.
Requirements:
- Scale of measurement should be interval or ratio
- Variables should be approximately normally distributed
- The association should be linear
- There should be no outliers in the data
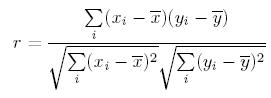
where:
- n is sample size
- _x_i and _y_i are the individual sample points indexed with i
- x-bar and y-bar are respective mean values
2. Spearman Correlation
Tests for the strength of the association between two ordinal variables (does not rely on the assumption of normally distributed data).
When data are measured on, at least, an ordinal scale, the ordered categories can be replaced by their ranks and Pearson’s correlation coefficient calculated on these ranks. Spearman’s Rank correlation coefficient is a technique which can be used to summarise the strength and direction.
The value r = 1 means a perfect positive correlation and the value r = -1 means a perfect negataive correlation. So, for example, you could use this test to find out whether people’s height and shoe size are correlated (they will be — the taller people are, the bigger their feet are likely to be).
#big-data #data-analysis #statistics #data #data analysis